Games Jobs in the City of London

Gaming
Central London > City of London

The table below looks at the prevalence of the term Games in permanent job vacancies in the City of London. Included is a benchmarking guide to the salaries offered in vacancies that cited Games over the 6 months leading up to 14 May 2025, comparing them to the same period in the previous two years.

6 months to
14 May 2025
Same period 2024 Same period 2023
Rank 86 129 172
Rank change year-on-year +43 +43 +7
Permanent jobs citing Games 58 53 67
As % of all permanent jobs advertised in the City of London 2.84% 1.59% 1.44%
As % of the General category 4.04% 2.58% 2.19%
Number of salaries quoted 39 47 52
10th Percentile - £36,750 £46,250
25th Percentile £56,250 £42,000 £47,500
Median annual salary (50th Percentile) £62,500 £50,000 £61,250
Median % change year-on-year +25.00% -18.37% -15.52%
75th Percentile £77,500 £67,500 £80,938
90th Percentile £105,000 £68,750 £108,625
Central London median annual salary £62,500 £50,000 £61,250
% change year-on-year +25.00% -18.37% -15.52%

All General Skills
City of London

Games falls under the General Skills category. For comparison with the information above, the following table provides summary statistics for all permanent job vacancies requiring common skills in the City of London.

Permanent vacancies with a requirement for common skills 1,435 2,056 3,060
As % of all permanent jobs advertised in the City of London 70.34% 61.52% 65.57%
Number of salaries quoted 1,019 1,615 2,489
10th Percentile £41,250 £40,000 £42,500
25th Percentile £52,000 £51,196 £54,750
Median annual salary (50th Percentile) £70,000 £72,500 £75,000
Median % change year-on-year -3.45% -3.33% +3.45%
75th Percentile £95,000 £93,125 £97,500
90th Percentile £120,000 £112,500 £115,250
Central London median annual salary £70,000 £70,000 £72,500
% change year-on-year - -3.45% +2.11%

Games
Job Vacancy Trend in the City of London

Job postings citing Games as a proportion of all IT jobs advertised in the City of London.
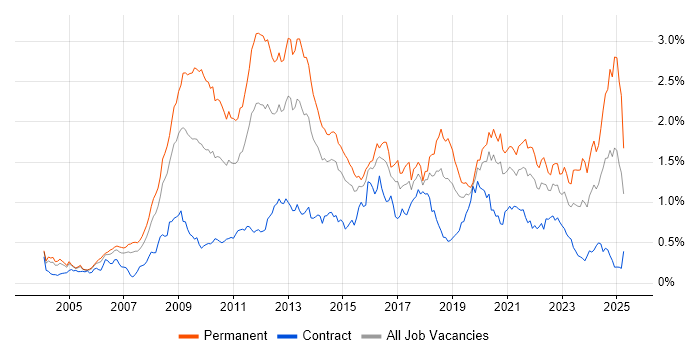
Job vacancy trend for Games in the City of London

Games
Salary Trend in the City of London

3-month moving average salary quoted in jobs citing Games in the City of London.

Salary trend for Games in the City of London

Games
Salary Histogram in the City of London

Salary distribution for jobs citing Games in the City of London over the 6 months to 14 May 2025.

Salary histogram for Games in the City of London

Games
Co-occurring Skills and Capabilities in the City of London by Category

The follow tables expand on the table above by listing co-occurrences grouped by category. The same employment type, locality and period is covered with up to 20 co-occurrences shown in each of the following categories:

Application Platforms
1 20 (34.48%) Apache Spark
Business Applications
1 12 (20.69%) Dynamics AX
Cloud Services
1 6 (10.34%) AWS
2 5 (8.62%) Cloud Computing
3 3 (5.17%) Amazon CloudWatch
3 3 (5.17%) Amazon ECS
4 2 (3.45%) Azure
5 1 (1.72%) Entra ID
5 1 (1.72%) Microsoft 365
Communications & Networking
1 20 (34.48%) HTTP
2 2 (3.45%) Broadband
2 2 (3.45%) Internet
Database & Business Intelligence
1 7 (12.07%) Relational Database
2 3 (5.17%) Amazon Athena
3 2 (3.45%) MySQL
3 2 (3.45%) Redis
Development Applications
1 2 (3.45%) Git
General
1 35 (60.34%) Finance
2 32 (55.17%) Retail
3 22 (37.93%) Social Skills
4 21 (36.21%) Inclusion and Diversity
5 20 (34.48%) Advertising
6 14 (24.14%) Telecoms
7 12 (20.69%) Manufacturing
8 9 (15.52%) Analytical Skills
9 3 (5.17%) Financial Institution
9 3 (5.17%) Legal
10 2 (3.45%) Billing
10 2 (3.45%) Law
11 1 (1.72%) Marketing
Job Titles
1 41 (70.69%) Senior
2 23 (39.66%) Senior Software Engineer
2 23 (39.66%) Software Engineer
3 9 (15.52%) Analyst
4 7 (12.07%) Qualitative Analyst
4 7 (12.07%) Quantitative Analyst
5 3 (5.17%) Head of Development
5 3 (5.17%) Head of Software Development
6 2 (3.45%) Developer
6 2 (3.45%) Python Developer
6 2 (3.45%) Senior Analyst
6 2 (3.45%) Senior Developer
6 2 (3.45%) Senior Python Developer
7 1 (1.72%) Change Manager
7 1 (1.72%) Digital Director
7 1 (1.72%) IT Director
7 1 (1.72%) IT Engineer
Libraries, Frameworks & Software Standards
1 22 (37.93%) Kafka
2 3 (5.17%) Lambda Expressions
2 3 (5.17%) Laravel
3 2 (3.45%) Django
3 2 (3.45%) GraphQL
3 2 (3.45%) Unity (Game Engine)
3 2 (3.45%) WebGL
Miscellaneous
1 20 (34.48%) Distributed Systems
2 12 (20.69%) Blockchain
2 12 (20.69%) Management Information System
2 12 (20.69%) Robotics
3 3 (5.17%) Algorithms
3 3 (5.17%) Cyberattack
3 3 (5.17%) Greenfield Project
4 2 (3.45%) Animation
4 2 (3.45%) Data Centre
4 2 (3.45%) Enterprise Software
4 2 (3.45%) IoT
4 2 (3.45%) Mobile App
5 1 (1.72%) Marketing Technology
Operating Systems
1 2 (3.45%) Linux
Processes & Methodologies
1 35 (60.34%) Agile
2 27 (46.55%) Machine Learning
3 26 (44.83%) Software Engineering
4 20 (34.48%) Computer Science
4 20 (34.48%) Performance Metrics
4 20 (34.48%) Programmatic Advertising
5 18 (31.03%) Artificial Intelligence
6 17 (29.31%) Analytics
7 13 (22.41%) Change Management
7 13 (22.41%) ERP
8 12 (20.69%) Coaching
8 12 (20.69%) Creative Thinking
8 12 (20.69%) Data Analytics
8 12 (20.69%) Information Security
8 12 (20.69%) IT Audit
8 12 (20.69%) Mentoring
8 12 (20.69%) Robotic Process Automation
9 7 (12.07%) Bayesian Methods
9 7 (12.07%) Predictive Modelling
9 7 (12.07%) Statistical Modelling
Programming Languages
1 29 (50.00%) Python
2 20 (34.48%) Scala
3 10 (17.24%) SQL
4 3 (5.17%) C#
4 3 (5.17%) PHP
5 2 (3.45%) HLSL
Qualifications
1 25 (43.10%) Degree
2 12 (20.69%) CISA
2 12 (20.69%) ISACA
3 3 (5.17%) Numerate Degree
4 2 (3.45%) ACCA
4 2 (3.45%) CIMA
5 1 (1.72%) APMG
Quality Assurance & Compliance
1 12 (20.69%) ITGC
2 3 (5.17%) NCSC
System Software
1 1 (1.72%) Active Directory
Systems Management
1 1 (1.72%) Microsoft Intune
Vendors
1 21 (36.21%) Microsoft
2 20 (34.48%) Apple
2 20 (34.48%) Google
3 12 (20.69%) Oracle
3 12 (20.69%) SAP
4 3 (5.17%) CrowdStrike