Oracle Jobs in the City of London

Oracle
Central London > City of London

The table below provides summary statistics for permanent job vacancies advertised in the City of London with a requirement for knowledge and experience of Oracle products and/or services. Included is a benchmarking guide to the salaries offered in vacancies that have cited Oracle over the 6 months to 28 April 2024 with a comparison to the same period in the previous 2 years.

The figures below represent the IT labour market in general and are not representative of salaries within the Oracle Corporation.

6 months to
28 Apr 2024
Same period 2023 Same period 2022
Rank 95 80 77
Rank change year-on-year -15 -3 +43
Permanent jobs citing Oracle 92 174 282
As % of all permanent jobs advertised in the City of London 2.74% 3.67% 3.99%
As % of the Vendors category 7.10% 9.33% 11.34%
Number of salaries quoted 64 137 226
10th Percentile £45,000 £51,250 £41,250
25th Percentile £55,375 £57,500 £60,000
Median annual salary (50th Percentile) £72,500 £85,000 £75,000
Median % change year-on-year -14.71% +13.33% +7.14%
75th Percentile £83,750 £101,250 £90,000
90th Percentile £91,750 £111,250 £103,750
Central London median annual salary £70,000 £85,000 £73,750
% change year-on-year -17.65% +15.25% +5.36%

All Vendors
City of London

Oracle is in the Vendor Products and Services category. The following table is for comparison with the above and provides summary statistics for all permanent job vacancies with a requirement for knowledge or experience of vendor products and services advertised in the City of London.

Permanent vacancies with a requirement for knowledge or experience of vendor products and services 1,295 1,864 2,486
As % of all permanent jobs advertised in the City of London 38.55% 39.30% 35.21%
Number of salaries quoted 992 1,473 1,843
10th Percentile £37,000 £37,500 £39,750
25th Percentile £47,500 £50,000 £51,250
Median annual salary (50th Percentile) £70,000 £69,000 £67,500
Median % change year-on-year +1.45% +2.22% -3.57%
75th Percentile £87,500 £90,000 £85,000
90th Percentile £105,000 £106,250 £101,150
Central London median annual salary £67,500 £67,500 £65,000
% change year-on-year - +3.85% -3.70%

Oracle
Job Vacancy Trend in the City of London

Job postings citing Oracle as a proportion of all IT jobs advertised in the City of London.
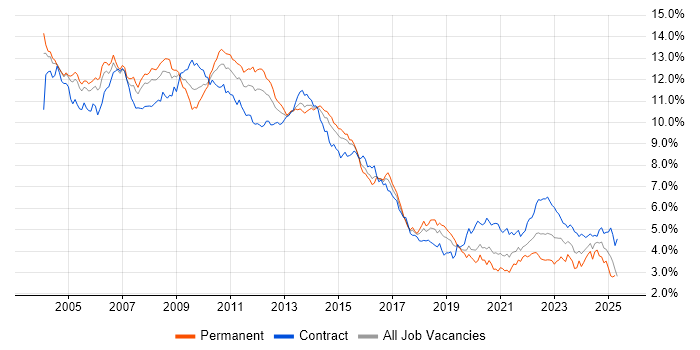
Job vacancy trend for Oracle in the City of London

Oracle
Salary Trend in the City of London

3-month moving average salary quoted in jobs citing Oracle in the City of London.

Salary trend for Oracle in the City of London

Oracle
Salary Histogram in the City of London

Salary distribution for jobs citing Oracle in the City of London over the 6 months to 28 April 2024.

Salary histogram for Oracle in the City of London

Oracle
Co-occurring Skills and Capabilities in the City of London by Category

The follow tables expand on the table above by listing co-occurrences grouped by category. The same employment type, locality and period is covered with up to 20 co-occurrences shown in each of the following categories:

Application Platforms
1 5 (5.43%) SharePoint
1 5 (5.43%) WebLogic
2 2 (2.17%) Confluence
2 2 (2.17%) SAS
3 1 (1.09%) Apache
3 1 (1.09%) IIS
3 1 (1.09%) JBoss
3 1 (1.09%) nginx
3 1 (1.09%) Site Server
3 1 (1.09%) Tomcat
3 1 (1.09%) WebSphere
3 1 (1.09%) WildFly
Applications
1 7 (7.61%) Microsoft Excel
2 5 (5.43%) Microsoft PowerPoint
3 4 (4.35%) Microsoft Office
4 2 (2.17%) Microsoft Project
4 2 (2.17%) MS Visio
Business Applications
1 4 (4.35%) Sparx Enterprise Architect
2 3 (3.26%) Oracle EBS
3 2 (2.17%) Oracle Assets
3 2 (2.17%) Oracle EBS R12
3 2 (2.17%) Oracle General Ledger
3 2 (2.17%) Oracle HRMS
3 2 (2.17%) Oracle Payables
3 2 (2.17%) Oracle Receivables
3 2 (2.17%) PeopleSoft Financials
3 2 (2.17%) PeopleSoft HCM
4 1 (1.09%) Oracle ERP
4 1 (1.09%) SAP ERP
4 1 (1.09%) SAP S/4HANA
4 1 (1.09%) Teamcenter
Cloud Services
1 31 (33.70%) AWS
2 27 (29.35%) Azure
3 13 (14.13%) Power Platform
4 8 (8.70%) Serverless
5 6 (6.52%) Dynamics 365
5 6 (6.52%) PaaS
5 6 (6.52%) SaaS
6 5 (5.43%) OCI
7 4 (4.35%) Amazon EKS
7 4 (4.35%) Amazon SQS
7 4 (4.35%) Azure Cosmos DB
7 4 (4.35%) GCP
7 4 (4.35%) GitHub
7 4 (4.35%) Microsoft 365
8 3 (3.26%) Amazon EC2
8 3 (3.26%) Amazon S3
8 3 (3.26%) Azure DevOps
8 3 (3.26%) PowerApps
9 2 (2.17%) Azure Data Factory
9 2 (2.17%) Azure Logic Apps
Communications & Networking
1 7 (7.61%) DNS
1 7 (7.61%) TCP/IP
2 4 (4.35%) BGP
2 4 (4.35%) SSL
3 2 (2.17%) SAN
4 1 (1.09%) DHCP
4 1 (1.09%) NAS
Database & Business Intelligence
1 23 (25.00%) SQL Server
2 22 (23.91%) PostgreSQL
3 20 (21.74%) Oracle Database
4 16 (17.39%) Relational Database
5 15 (16.30%) MySQL
6 12 (13.04%) RDBMS
7 10 (10.87%) Power BI
8 8 (8.70%) Oracle Reports
9 7 (7.61%) Oracle Database 11g
9 7 (7.61%) SQL Server Reporting Services
10 6 (6.52%) Delta Lake
11 5 (5.43%) Amazon RDS
12 4 (4.35%) Azure SQL Database
12 4 (4.35%) SQL Server Integration Services
13 3 (3.26%) Data Warehouse
13 3 (3.26%) Metadata
13 3 (3.26%) NoSQL
13 3 (3.26%) SQL Server Analysis Services
14 2 (2.17%) Amazon QuickSight
14 2 (2.17%) Data Vault
Development Applications
1 11 (11.96%) Git
2 6 (6.52%) GitLab
3 5 (5.43%) JIRA
3 5 (5.43%) Oracle APEX
4 3 (3.26%) JDeveloper
5 2 (2.17%) PeopleTools
5 2 (2.17%) SoapUI
5 2 (2.17%) Toad
6 1 (1.09%) JMeter
6 1 (1.09%) Postman
6 1 (1.09%) Selenium
6 1 (1.09%) SpecFlow
6 1 (1.09%) Team Foundation Server
6 1 (1.09%) TeamCity
6 1 (1.09%) Visual Studio
General
1 30 (32.61%) Finance
2 20 (21.74%) Social Skills
3 14 (15.22%) Analytical Skills
4 10 (10.87%) Law
5 7 (7.61%) Banking
6 3 (3.26%) Documentation Skills
7 2 (2.17%) Advertising
7 2 (2.17%) Investment Banking
7 2 (2.17%) Legal
7 2 (2.17%) Pharmaceutical
7 2 (2.17%) Public Sector
8 1 (1.09%) Financial Institution
8 1 (1.09%) Front Office
8 1 (1.09%) Inclusion and Diversity
8 1 (1.09%) Manufacturing
8 1 (1.09%) Organisational Skills
8 1 (1.09%) Presentation Skills
Job Titles
1 21 (22.83%) Developer
2 18 (19.57%) Lead
2 18 (19.57%) Senior
3 16 (17.39%) Analyst
4 12 (13.04%) Architect
5 8 (8.70%) Financial Analyst
5 8 (8.70%) Senior Developer
5 8 (8.70%) Solutions Architect
6 7 (7.61%) Database Developer
6 7 (7.61%) Oracle Analyst
6 7 (7.61%) PostgreSQL Developer
7 6 (6.52%) Business Analyst
7 6 (6.52%) Senior Database Developer
8 4 (4.35%) Consultant
8 4 (4.35%) Financial Business Analyst
8 4 (4.35%) Infrastructure Engineer
8 4 (4.35%) Lead Architect
8 4 (4.35%) Project Leader
8 4 (4.35%) Support Analyst
8 4 (4.35%) Team Leader
Libraries, Frameworks & Software Standards
1 9 (9.78%) REST
2 6 (6.52%) .NET
2 6 (6.52%) React
3 5 (5.43%) SOAP
3 5 (5.43%) Web Services
4 4 (4.35%) Lightning Web Components
4 4 (4.35%) RabbitMQ
4 4 (4.35%) Spring Boot
5 3 (3.26%) Node.js
5 3 (3.26%) Oracle Fusion
6 2 (2.17%) .NET Framework
6 2 (2.17%) CSS
6 2 (2.17%) HTML
6 2 (2.17%) XML
7 1 (1.09%) COM
7 1 (1.09%) JSON
7 1 (1.09%) WSDL
7 1 (1.09%) XML Messaging
7 1 (1.09%) XSD
7 1 (1.09%) XSLT
Miscellaneous
1 9 (9.78%) Management Information System
2 7 (7.61%) Public Cloud
3 6 (6.52%) Enterprise Software
3 6 (6.52%) Private Cloud
4 5 (5.43%) Reinsurance
5 4 (4.35%) Data Centre
5 4 (4.35%) Onboarding
6 3 (3.26%) Self-Motivation
7 2 (2.17%) Biopharmaceutical
7 2 (2.17%) Data Structures
7 2 (2.17%) Driving Licence
7 2 (2.17%) Learning Management System
7 2 (2.17%) Life Science
7 2 (2.17%) LIMS
7 2 (2.17%) Robotics
8 1 (1.09%) Credit Derivative
8 1 (1.09%) Derivative
8 1 (1.09%) Foreign Exchange (FX)
8 1 (1.09%) FPGA
8 1 (1.09%) Replication
Operating Systems
1 14 (15.22%) Linux
2 7 (7.61%) Windows
3 5 (5.43%) Red Hat Enterprise Linux
3 5 (5.43%) Unix
4 3 (3.26%) Windows Server
5 1 (1.09%) AIX
5 1 (1.09%) CentOS
5 1 (1.09%) Mac OS
5 1 (1.09%) Oracle Linux
Processes & Methodologies
1 31 (33.70%) Agile
2 23 (25.00%) Problem-Solving
3 19 (20.65%) Migration
4 18 (19.57%) Actionable Insight
5 17 (18.48%) Data Migration
6 15 (16.30%) Unit Testing
7 14 (15.22%) Analytics
8 13 (14.13%) Data Modelling
9 12 (13.04%) Business Intelligence
9 12 (13.04%) Project Management
10 11 (11.96%) Software Engineering
11 10 (10.87%) Containerisation
11 10 (10.87%) DevOps
11 10 (10.87%) ETL
11 10 (10.87%) Requirements Analysis
12 9 (9.78%) Code Quality
12 9 (9.78%) Collaborative Working
12 9 (9.78%) Microservices
12 9 (9.78%) Performance Tuning
12 9 (9.78%) Scrum
Programming Languages
1 43 (46.74%) SQL
2 14 (15.22%) Java
3 13 (14.13%) Python
4 11 (11.96%) PL/SQL
5 9 (9.78%) JavaScript
6 7 (7.61%) C#
7 5 (5.43%) Bash
7 5 (5.43%) Perl
7 5 (5.43%) T-SQL
8 4 (4.35%) Apex Code
8 4 (4.35%) SOQL
9 3 (3.26%) C++
9 3 (3.26%) Data Analysis Expressions
9 3 (3.26%) Go
9 3 (3.26%) Ruby
10 2 (2.17%) MATLAB
10 2 (2.17%) PowerShell
10 2 (2.17%) R
10 2 (2.17%) Shell Script
10 2 (2.17%) TypeScript
Qualifications
1 7 (7.61%) Degree
2 6 (6.52%) SC Cleared
2 6 (6.52%) Security Cleared
3 4 (4.35%) AWS Certification
3 4 (4.35%) AWS Certified Solutions Architect
3 4 (4.35%) Azure Certification
3 4 (4.35%) PMI Certification
3 4 (4.35%) PMP
4 1 (1.09%) Computer Science Degree
4 1 (1.09%) IBM Certification
4 1 (1.09%) LPIC
4 1 (1.09%) MCP
4 1 (1.09%) MCSE
4 1 (1.09%) Microsoft Certification
Quality Assurance & Compliance
1 4 (4.35%) QA
2 3 (3.26%) Data Quality
3 2 (2.17%) SLA
System Software
1 7 (7.61%) Docker
2 2 (2.17%) Oracle RAC
3 1 (1.09%) VMware Infrastructure
Systems Management
1 7 (7.61%) Kubernetes
2 2 (2.17%) Ansible
2 2 (2.17%) Data Guard
2 2 (2.17%) Oracle RMAN
3 1 (1.09%) Nagios
3 1 (1.09%) Prometheus
3 1 (1.09%) Red Hat Spacewalk
3 1 (1.09%) Terraform
Vendors
1 19 (20.65%) Microsoft
2 7 (7.61%) Databricks
3 5 (5.43%) Informatica
3 5 (5.43%) Salesforce
4 4 (4.35%) Apttus
4 4 (4.35%) DocuSign
4 4 (4.35%) Sparx
5 3 (3.26%) SAP
6 2 (2.17%) IBM
6 2 (2.17%) PeopleSoft
6 2 (2.17%) Sybase
6 2 (2.17%) VMware
7 1 (1.09%) Dell
7 1 (1.09%) F5
7 1 (1.09%) Google
7 1 (1.09%) HP
7 1 (1.09%) Murex
7 1 (1.09%) Progress
7 1 (1.09%) Red Hat
7 1 (1.09%) Workday