React Jobs in Edinburgh

React.js
Scotland > Edinburgh

The table below provides summary statistics for permanent job vacancies advertised in Edinburgh requiring React skills. It includes a benchmarking guide to the annual salaries offered in vacancies that cited React over the 6 months leading up to 3 April 2025, comparing them to the same period in the previous two years.

6 months to
3 Apr 2025
Same period 2024 Same period 2023
Rank 31 16 38
Rank change year-on-year -15 +22 -26
Permanent jobs citing React 85 172 191
As % of all permanent jobs advertised in Edinburgh 8.73% 11.45% 8.42%
As % of the Libraries, Frameworks & Software Standards category 32.57% 40.38% 24.09%
Number of salaries quoted 73 126 128
10th Percentile £42,500 £50,000 £44,033
25th Percentile £52,500 £55,000 £50,000
Median annual salary (50th Percentile) £65,000 £65,000 £63,603
Median % change year-on-year - +2.20% +15.64%
75th Percentile £93,778 £75,000 £77,715
90th Percentile £98,474 £91,934 £110,000
Scotland median annual salary £60,000 £60,000 £60,000
% change year-on-year - - +9.09%

All Software Libraries and Frameworks
Edinburgh

React falls under the Software Libraries and Frameworks category. For comparison with the information above, the following table provides summary statistics for all permanent job vacancies requiring technical specification, industry standards, software libraries and framework skills in Edinburgh.

Permanent vacancies with a requirement for technical specification, industry standards, software libraries and framework skills 261 426 793
As % of all permanent jobs advertised in Edinburgh 26.80% 28.36% 34.95%
Number of salaries quoted 194 299 470
10th Percentile £42,500 £46,306 £41,250
25th Percentile £51,250 £55,000 £51,634
Median annual salary (50th Percentile) £65,750 £65,000 £67,634
Median % change year-on-year +1.15% -3.89% +22.97%
75th Percentile £93,778 £75,000 £82,536
90th Percentile £100,000 £91,934 £97,500
Scotland median annual salary £60,000 £60,000 £62,500
% change year-on-year - -4.00% +13.64%

React
Job Vacancy Trend in Edinburgh

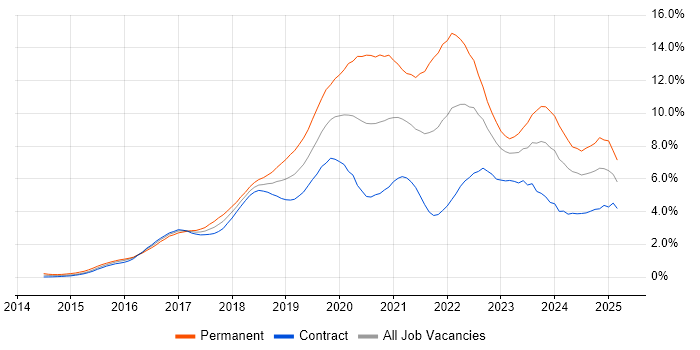
Job postings citing React as a proportion of all IT jobs advertised in Edinburgh.

Job vacancy trend for React in Edinburgh

React
Salary Trend in Edinburgh

3-month moving average salary quoted in jobs citing React in Edinburgh.

Salary trend for React in Edinburgh

React
Salary Histogram in Edinburgh

Salary distribution for jobs citing React in Edinburgh over the 6 months to 3 April 2025.

Salary histogram for React in Edinburgh

React
Co-occurring Skills and Capabilities in Edinburgh by Category

The follow tables expand on the table above by listing co-occurrences grouped by category. The same employment type, locality and period is covered with up to 20 co-occurrences shown in each of the following categories:

Application Platforms
1 12 (14.12%) Umbraco
2 2 (2.35%) Solana
3 1 (1.18%) CMS
3 1 (1.18%) Headless CMS
3 1 (1.18%) SharePoint
Cloud Services
1 40 (47.06%) AWS
2 32 (37.65%) Azure
3 31 (36.47%) GCP
4 7 (8.24%) Serverless
5 6 (7.06%) GitHub
6 5 (5.88%) AWS Lambda
6 5 (5.88%) Google Analytics
7 4 (4.71%) Adobe Analytics
8 3 (3.53%) Azure DevOps
8 3 (3.53%) npm
9 2 (2.35%) Azure Monitor
9 2 (2.35%) Firebase
9 2 (2.35%) SaaS
9 2 (2.35%) Stripe
10 1 (1.18%) Datadog
10 1 (1.18%) Entra ID
10 1 (1.18%) GitHub Actions
10 1 (1.18%) Google Ads
10 1 (1.18%) OpenShift
Communications & Networking
1 2 (2.35%) Kerberos
Database & Business Intelligence
1 11 (12.94%) BigQuery
2 9 (10.59%) MySQL
3 6 (7.06%) MongoDB
3 6 (7.06%) NoSQL
4 5 (5.88%) DynamoDB
4 5 (5.88%) SQL Server
5 4 (4.71%) PostgreSQL
6 2 (2.35%) Relational Database
Development Applications
1 10 (11.76%) webpack
2 9 (10.59%) Git
3 7 (8.24%) Jenkins
4 4 (4.71%) GitLab
5 2 (2.35%) Cypress.io
5 2 (2.35%) Fiddler
5 2 (2.35%) Postman
5 2 (2.35%) TeamCity
5 2 (2.35%) Visual Studio
6 1 (1.18%) Appium
6 1 (1.18%) ESLint
6 1 (1.18%) JIRA
6 1 (1.18%) Mocha
6 1 (1.18%) Selenium
6 1 (1.18%) SonarQube
6 1 (1.18%) Sonatype Nexus
General
1 28 (32.94%) Finance
2 21 (24.71%) Banking
3 15 (17.65%) Inclusion and Diversity
4 11 (12.94%) Social Skills
5 5 (5.88%) Games
5 5 (5.88%) Tech for Good
6 2 (2.35%) Digital Health
7 1 (1.18%) Advertising
7 1 (1.18%) Analytical Skills
7 1 (1.18%) Health Technology
7 1 (1.18%) Public Sector
Job Titles
1 33 (38.82%) Developer
2 31 (36.47%) Senior
2 31 (36.47%) Software Engineer
3 19 (22.35%) Senior Software Engineer
4 16 (18.82%) Lead
5 12 (14.12%) Architect
5 12 (14.12%) Senior Developer
6 11 (12.94%) Lead Architect
6 11 (12.94%) Lead Solutions Architect
6 11 (12.94%) Solutions Architect
7 9 (10.59%) Front-End Developer (Client-Side Developer)
7 9 (10.59%) PHP Developer
8 6 (7.06%) Front-End Engineer (Client-Side Engineer)
8 6 (7.06%) Senior Front-End Engineer (Client-Side Engineer)
8 6 (7.06%) Software Developer
9 5 (5.88%) .NET Developer
9 5 (5.88%) React Developer
9 5 (5.88%) Senior PHP Developer
9 5 (5.88%) Senior Software Developer
10 4 (4.71%) Full-Stack Engineer
Libraries, Frameworks & Software Standards
1 30 (35.29%) CSS
2 24 (28.24%) Node.js
3 15 (17.65%) HTML
4 13 (15.29%) AngularJS
4 13 (15.29%) jQuery
4 13 (15.29%) OAuth
4 13 (15.29%) OpenID
4 13 (15.29%) SAML
5 12 (14.12%) Redux
6 11 (12.94%) Ajax
6 11 (12.94%) REST
6 11 (12.94%) RESTful
7 10 (11.76%) React Native
8 9 (10.59%) Laravel
9 8 (9.41%) GraphQL
9 8 (9.41%) Spring
10 7 (8.24%) .NET
10 7 (8.24%) Jest
11 6 (7.06%) ASP.NET
11 6 (7.06%) HTML5
Miscellaneous
1 12 (14.12%) Greenfield Project
2 5 (5.88%) Public Cloud
3 4 (4.71%) Algorithms
3 4 (4.71%) Mobile App
4 3 (3.53%) Data Structures
5 2 (2.35%) Renewable Energy
5 2 (2.35%) Smart City
5 2 (2.35%) Virtual Team
5 2 (2.35%) Wiki
6 1 (1.18%) Cloud Native
6 1 (1.18%) Distributed Systems
6 1 (1.18%) Legacy Applications
6 1 (1.18%) Mobile Banking
6 1 (1.18%) Product Ownership
Operating Systems
1 4 (4.71%) Linux
2 2 (2.35%) Android
2 2 (2.35%) Apple iOS
Processes & Methodologies
1 42 (49.41%) Software Engineering
2 27 (31.76%) DevOps
3 23 (27.06%) Problem-Solving
4 19 (22.35%) Agile
4 19 (22.35%) CI/CD
5 17 (20.00%) Full-Stack Development
5 17 (20.00%) Microservices
5 17 (20.00%) Web Development
6 16 (18.82%) Analytics
7 14 (16.47%) Clean Code
7 14 (16.47%) MVC
7 14 (16.47%) Test Automation
8 12 (14.12%) Cybersecurity
9 11 (12.94%) Content Management
9 11 (12.94%) Data Analytics
9 11 (12.94%) Domain-Driven Design
9 11 (12.94%) Front End Development
9 11 (12.94%) Software Deployment
9 11 (12.94%) User Experience
10 10 (11.76%) Roadmaps
Programming Languages
1 53 (62.35%) JavaScript
2 49 (57.65%) TypeScript
3 18 (21.18%) Java
4 11 (12.94%) PHP
5 5 (5.88%) Python
6 4 (4.71%) C#
6 4 (4.71%) SQL
7 3 (3.53%) Go
8 2 (2.35%) Groovy
8 2 (2.35%) Kotlin
8 2 (2.35%) Objective-C
8 2 (2.35%) Swift
9 1 (1.18%) PowerShell
9 1 (1.18%) Shell Script
9 1 (1.18%) VBA
Qualifications
1 2 (2.35%) Degree
2 1 (1.18%) Computer Science Degree
Quality Assurance & Compliance
1 4 (4.71%) QA
2 2 (2.35%) Accessibility
System Software
1 11 (12.94%) Docker
2 1 (1.18%) NDS
Systems Management
1 19 (22.35%) Kubernetes
2 11 (12.94%) Single Sign-On
3 1 (1.18%) CA Single Sign-On
3 1 (1.18%) PingFederate
3 1 (1.18%) Terraform
Vendors
1 14 (16.47%) Microsoft
2 7 (8.24%) Google
3 4 (4.71%) Adobe
3 4 (4.71%) Tealium
4 2 (2.35%) ForgeRock
4 2 (2.35%) Ping Identity
4 2 (2.35%) Yahoo!
5 1 (1.18%) NetIQ
5 1 (1.18%) Okta
5 1 (1.18%) Oracle
5 1 (1.18%) TikTok