Inclusion and Diversity Jobs in Glasgow

Inclusion and Diversity
Scotland > Glasgow

The table below looks at the prevalence of the term Inclusion and Diversity in permanent job vacancies advertised in Glasgow. Included is a benchmarking guide to the salaries offered in vacancies that have cited Inclusion and Diversity over the 6 months to 8 May 2024 with a comparison to the same period over the previous 2 years.

6 months to
8 May 2024
Same period 2023 Same period 2022
Rank 2 46 53
Rank change year-on-year +44 +7 +37
Permanent jobs citing Inclusion and Diversity 2,634 91 73
As % of all permanent jobs advertised in Glasgow 66.06% 5.89% 4.55%
As % of the General category 81.25% 8.58% 7.40%
Number of salaries quoted 56 63 65
10th Percentile £28,750 £32,500 £25,000
25th Percentile £37,500 £40,000 £42,500
Median annual salary (50th Percentile) £54,000 £45,000 £50,000
Median % change year-on-year +20.00% -10.00% +5.26%
75th Percentile £65,000 £55,000 £60,000
90th Percentile £80,000 £75,000 £68,750
Scotland median annual salary £50,000 £57,500 £52,500
% change year-on-year -13.04% +9.52% +10.53%

All General Skills
Glasgow

Inclusion and Diversity is in the General Skills category. The following table is for comparison with the above and provides summary statistics for all permanent job vacancies advertised in Glasgow with a requirement for common skills.

Permanent vacancies with a requirement for common skills 3,242 1,060 987
As % of all permanent jobs advertised in Glasgow 81.31% 68.56% 61.53%
Number of salaries quoted 440 391 527
10th Percentile £28,500 £32,925 £28,550
25th Percentile £40,000 £41,250 £36,250
Median annual salary (50th Percentile) £50,000 £55,000 £48,000
Median % change year-on-year -9.09% +14.58% -1.54%
75th Percentile £65,000 £67,500 £63,000
90th Percentile £80,000 £77,500 £77,500
Scotland median annual salary £51,500 £57,500 £54,500
% change year-on-year -10.43% +5.50% +9.00%

Inclusion and Diversity
Job Vacancy Trend in Glasgow

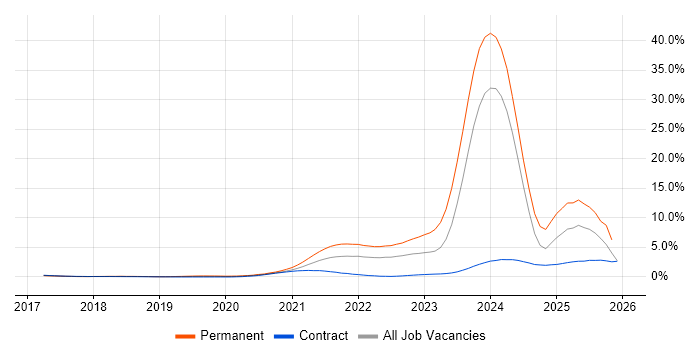
Job postings citing Inclusion and Diversity as a proportion of all IT jobs advertised in Glasgow.

Job vacancy trend for Inclusion and Diversity in Glasgow

Inclusion and Diversity
Salary Trend in Glasgow

3-month moving average salary quoted in jobs citing Inclusion and Diversity in Glasgow.

Salary trend for Inclusion and Diversity in Glasgow

Inclusion and Diversity
Salary Histogram in Glasgow

Salary distribution for jobs citing Inclusion and Diversity in Glasgow over the 6 months to 8 May 2024.

Salary histogram for Inclusion and Diversity in Glasgow

Inclusion and Diversity
Co-occurring Skills and Capabilities in Glasgow by Category

The follow tables expand on the table above by listing co-occurrences grouped by category. The same employment type, locality and period is covered with up to 20 co-occurrences shown in each of the following categories:

Application Platforms
1 592 (22.48%) Apache Spark
2 141 (5.35%) Apache
3 117 (4.44%) Apache Airflow
4 98 (3.72%) FileNet
5 32 (1.21%) Cloud Foundry
6 29 (1.10%) Confluence
7 21 (0.80%) GemFire
8 20 (0.76%) Camunda
9 11 (0.42%) CICS
10 10 (0.38%) Tomcat
11 7 (0.27%) Microsoft Exchange
12 5 (0.19%) WebSphere
13 2 (0.076%) WebLogic
14 1 (0.038%) Office Communications Server
14 1 (0.038%) Tuxedo
Applications
1 32 (1.21%) UserZoom
2 15 (0.57%) Sketch
3 3 (0.11%) InVision
3 3 (0.11%) Microsoft Office
4 2 (0.076%) Microsoft Excel
5 1 (0.038%) Microsoft PowerPoint
5 1 (0.038%) MS Visio
Business Applications
1 15 (0.57%) Endur
2 2 (0.076%) Oracle EBS
Cloud Services
1 1,201 (45.60%) AWS
2 151 (5.73%) Azure
3 117 (4.44%) Datadog
4 103 (3.91%) GCP
5 98 (3.72%) Amazon S3
6 94 (3.57%) Figma
7 75 (2.85%) SurveyMonkey
8 70 (2.66%) Amazon EKS
9 69 (2.62%) Amazon ECS
10 56 (2.13%) Amazon CloudWatch
11 54 (2.05%) Serverless
12 51 (1.94%) Amazon EC2
12 51 (1.94%) Amazon EMR
12 51 (1.94%) Amazon SQS
12 51 (1.94%) AWS Lambda
13 48 (1.82%) BlazeMeter
14 46 (1.75%) Cloud Computing
15 45 (1.71%) GitHub
16 25 (0.95%) Google Play
17 13 (0.49%) Microsoft 365
Communications & Networking
1 82 (3.11%) Kerberos
2 18 (0.68%) DSL
3 2 (0.076%) RS-232
3 2 (0.076%) TCP/IP
4 1 (0.038%) SAN
4 1 (0.038%) VPN
Database & Business Intelligence
1 667 (25.32%) NoSQL
2 504 (19.13%) Big Data
3 233 (8.85%) Hadoop
4 152 (5.77%) Apache Cassandra
5 147 (5.58%) Elasticsearch
6 131 (4.97%) Apache Hive
7 126 (4.78%) Relational Database
8 107 (4.06%) MongoDB
9 102 (3.87%) HBase
10 66 (2.51%) Data Lake
11 65 (2.47%) Metadata
12 52 (1.97%) Electronic Patient Records
13 39 (1.48%) Qlik Sense
14 38 (1.44%) CockroachDB
15 31 (1.18%) SQL Server
16 29 (1.10%) DB2
17 28 (1.06%) MySQL
18 21 (0.80%) Hazelcast
18 21 (0.80%) Tableau
19 20 (0.76%) Looker
Development Applications
1 304 (11.54%) Jenkins
2 210 (7.97%) JUnit
3 185 (7.02%) Git
4 121 (4.59%) Jasmine
5 86 (3.26%) Bitbucket Server
6 84 (3.19%) Cypress.io
7 81 (3.08%) JIRA
8 75 (2.85%) Karma Test Runner
9 70 (2.66%) Bitbucket
10 65 (2.47%) Artifactory
11 64 (2.43%) Maven
12 61 (2.32%) Selenium
13 60 (2.28%) Protractor
13 60 (2.28%) WebDriver
14 45 (1.71%) Mockito
15 31 (1.18%) CircleCI
16 30 (1.14%) Gradle
17 28 (1.06%) GitLab
17 28 (1.06%) JMeter
18 25 (0.95%) Android Studio
General
1 2,579 (97.91%) Finance
2 2,563 (97.30%) Law
3 1,427 (54.18%) Marketing
4 677 (25.70%) Legal
5 457 (17.35%) Banking
6 364 (13.82%) Investment Banking
7 254 (9.64%) Financial Institution
8 216 (8.20%) Social Skills
9 182 (6.91%) Influencing Skills
10 92 (3.49%) Private Banking
11 72 (2.73%) Presentation Skills
12 56 (2.13%) Analytical Skills
13 32 (1.21%) Social Science
14 27 (1.03%) Games
15 22 (0.84%) Prime Brokerage
16 18 (0.68%) Front Office
17 16 (0.61%) Public Sector
18 15 (0.57%) Publishing
19 11 (0.42%) Back Office
20 9 (0.34%) Retail
Job Titles
1 1,994 (75.70%) Software Engineer
2 795 (30.18%) Java Engineer
2 795 (30.18%) Java Software Engineer
3 780 (29.61%) Lead
4 685 (26.01%) Lead Software Engineer
5 390 (14.81%) Big Data Engineer
5 390 (14.81%) Big Data Software Engineer
6 331 (12.57%) Python Engineer
6 331 (12.57%) Python Software Engineer
7 320 (12.15%) Full Stack Engineer
7 320 (12.15%) Full Stack Software Engineer
8 305 (11.58%) Senior
9 301 (11.43%) AWS Engineer
9 301 (11.43%) AWS Software Engineer
10 278 (10.55%) Lead Java Engineer
11 248 (9.42%) Data Engineer
12 228 (8.66%) Scala Engineer
12 228 (8.66%) Scala Software Engineer
13 212 (8.05%) Engineering Manager
13 212 (8.05%) Software Engineering Manager
Libraries, Frameworks & Software Standards
1 675 (25.63%) Spring
2 495 (18.79%) React
3 398 (15.11%) AngularJS
4 352 (13.36%) Kafka
5 340 (12.91%) Spring Boot
6 269 (10.21%) HTML
7 246 (9.34%) J2EE
8 240 (9.11%) CSS
9 203 (7.71%) JSON
10 194 (7.37%) Hibernate
11 187 (7.10%) RESTful
12 180 (6.83%) Node.js
13 174 (6.61%) PySpark
14 171 (6.49%) JMS
15 166 (6.30%) Twitter Bootstrap
16 154 (5.85%) jQuery
17 138 (5.24%) Web Services
18 125 (4.75%) GraphQL
19 109 (4.14%) XML
20 103 (3.91%) REST
Miscellaneous
1 920 (34.93%) Cloud Native
2 795 (30.18%) Algorithms
3 285 (10.82%) Public Cloud
4 169 (6.42%) Onboarding
5 150 (5.69%) Product Ownership
6 142 (5.39%) Management Information System
7 137 (5.20%) Reference Data
8 131 (4.97%) Market Risk
9 107 (4.06%) Data Structures
10 65 (2.47%) Distributed Applications
10 65 (2.47%) Enterprise Cloud
11 51 (1.94%) Credit Risk
12 43 (1.63%) Legacy Code
13 30 (1.14%) Private Cloud
14 29 (1.10%) Foreign Exchange (FX)
15 25 (0.95%) Legacy Systems
16 21 (0.80%) Replication
16 21 (0.80%) Taxonomies
17 20 (0.76%) Distributed Systems
18 16 (0.61%) Self-Motivation
Operating Systems
1 143 (5.43%) Unix
2 100 (3.80%) Linux
3 25 (0.95%) Android
4 6 (0.23%) Windows
5 3 (0.11%) Windows Server
6 1 (0.038%) Solaris
Processes & Methodologies
1 2,369 (89.94%) Software Engineering
2 2,326 (88.31%) Agile
3 2,082 (79.04%) SDLC
4 1,965 (74.60%) CI/CD
5 1,877 (71.26%) Operational Stability
6 1,387 (52.66%) Machine Learning
7 1,385 (52.58%) Artificial Intelligence
8 1,305 (49.54%) Community of Practice
9 885 (33.60%) Visualisation
10 835 (31.70%) Continuous Improvement
11 711 (26.99%) Risk Management
12 557 (21.15%) Decision-Making
13 479 (18.19%) Continuous Delivery
14 477 (18.11%) Microservices
15 442 (16.78%) Information Architecture
16 415 (15.76%) Architectural Design
17 371 (14.09%) Problem-Solving
18 360 (13.67%) Full Stack Development
19 357 (13.55%) Computer Science
20 261 (9.91%) Test Automation
Programming Languages
1 1,651 (62.68%) Java
2 1,066 (40.47%) SQL
3 922 (35.00%) Python
4 320 (12.15%) JavaScript
5 319 (12.11%) Scala
6 212 (8.05%) TypeScript
7 148 (5.62%) PL/SQL
8 82 (3.11%) Go
9 66 (2.51%) C#
10 65 (2.47%) Prolog
10 65 (2.47%) SPARQL
11 38 (1.44%) T-SQL
12 37 (1.40%) Groovy
13 34 (1.29%) R
14 27 (1.03%) Kotlin
15 23 (0.87%) Shell Script
16 20 (0.76%) Ruby
17 14 (0.53%) C++
18 11 (0.42%) COBOL
18 11 (0.42%) JCL
Qualifications
1 203 (7.71%) Degree
2 81 (3.08%) Master's Degree
3 49 (1.86%) PhD
4 40 (1.52%) Computer Science Degree
5 20 (0.76%) AWS Certification
6 7 (0.27%) Security Cleared
7 6 (0.23%) AWS Certified Cloud Practitioner
7 6 (0.23%) CISM
7 6 (0.23%) CISSP
8 4 (0.15%) SC Cleared
9 2 (0.076%) DV Cleared
9 2 (0.076%) MCSE
9 2 (0.076%) Microsoft Certification
9 2 (0.076%) OCA
9 2 (0.076%) OCP
9 2 (0.076%) Oracle Certification
10 1 (0.038%) CBAP
10 1 (0.038%) HNC
10 1 (0.038%) ICAEW
10 1 (0.038%) PRINCE2 Certification
Quality Assurance & Compliance
1 82 (3.11%) Accessibility
2 62 (2.35%) SLA
3 38 (1.44%) Data Quality
4 32 (1.21%) Actionable Recommendations
5 20 (0.76%) PMO
6 15 (0.57%) WAI
7 11 (0.42%) QA
8 10 (0.38%) NIST
9 3 (0.11%) WCAG
10 1 (0.038%) IEC 61508
System Software
1 102 (3.87%) HDFS
2 68 (2.58%) Active Directory
3 49 (1.86%) Docker
4 11 (0.42%) Time Sharing Option
5 2 (0.076%) Apache ZooKeeper
Systems Management
1 334 (12.68%) Kubernetes
2 258 (9.79%) Terraform
3 175 (6.64%) Grafana
4 79 (3.00%) Prometheus
5 26 (0.99%) ITRS Geneos
6 21 (0.80%) HAProxy
6 21 (0.80%) Kibana
6 21 (0.80%) Zipkin
7 7 (0.27%) Graphite
Vendors
1 362 (13.74%) Oracle
2 263 (9.98%) Databricks
3 185 (7.02%) Splunk
4 162 (6.15%) Dynatrace
5 87 (3.30%) Informatica
6 72 (2.73%) Cloudera
7 68 (2.58%) Google
8 64 (2.43%) Qualtrics
9 57 (2.16%) Alteryx
10 26 (0.99%) Microsoft
11 23 (0.87%) Sybase
12 21 (0.80%) Atlassian
13 20 (0.76%) Pega
14 18 (0.68%) Cognos
14 18 (0.68%) SaltStack
15 12 (0.46%) ServiceNow
16 11 (0.42%) OpenLink
17 9 (0.34%) TOWER Software
18 6 (0.23%) CA
19 5 (0.19%) AppDynamics