Infrastructure Engineering Job Trends in Glasgow

Infrastructure Engineering
Scotland > Glasgow

The table below provides summary statistics and salary benchmarking for jobs advertised in Glasgow requiring Infrastructure Engineering skills. It covers vacancies from the 6 months leading up to 18 September 2025, with comparisons to the same periods in the previous two years.

6 months to
18 Sep 2025
Same period 2024 Same period 2023
Rank 65 116 36
Rank change year-on-year +51 -80 +53
Permanent jobs citing Infrastructure Engineering 18 33 37
As % of all permanent jobs advertised in Glasgow 2.41% 1.76% 4.71%
As % of the Processes & Methodologies category 2.66% 1.93% 4.86%
Number of salaries quoted 12 30 19
10th Percentile - £37,250 £36,250
25th Percentile £36,250 £40,000 £44,875
Median annual salary (50th Percentile) £61,250 £50,000 £55,000
Median % change year-on-year +22.50% -9.09% +22.22%
75th Percentile £65,313 £52,500 £60,000
90th Percentile £70,000 £61,375 £66,300
Scotland median annual salary £52,500 £46,250 £55,000
% change year-on-year +13.51% -15.91% +15.79%

All Process and Methodology Skills
Glasgow

Infrastructure Engineering falls under the Processes and Methodologies category. For comparison with the information above, the following table provides summary statistics for all permanent job vacancies requiring process or methodology skills in Glasgow.

Permanent vacancies with a requirement for process or methodology skills 676 1,706 761
As % of all permanent jobs advertised in Glasgow 90.50% 91.04% 96.82%
Number of salaries quoted 270 564 582
10th Percentile £29,500 £31,250 £33,775
25th Percentile £35,000 £40,250 £42,500
Median annual salary (50th Percentile) £52,500 £55,000 £55,000
Median % change year-on-year -4.55% - +4.76%
75th Percentile £71,250 £70,000 £67,000
90th Percentile £85,000 £81,750 £75,000
Scotland median annual salary £38,000 £55,000 £52,500
% change year-on-year -30.91% +4.76% -4.55%

Infrastructure Engineering
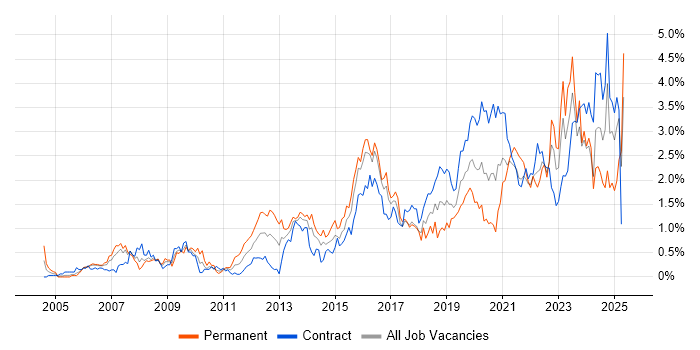
Job Vacancy Trend in Glasgow

Job postings citing Infrastructure Engineering as a proportion of all IT jobs advertised in Glasgow.

Job vacancy trend for Infrastructure Engineering in Glasgow

Infrastructure Engineering
Salary Trend in Glasgow

Salary distribution trend for jobs in Glasgow citing Infrastructure Engineering.

Salary distribution trend for jobs in Glasgow citing Infrastructure Engineering

Infrastructure Engineering
Salary Histogram in Glasgow

Salary distribution for jobs citing Infrastructure Engineering in Glasgow over the 6 months to 18 September 2025.

Salary histogram for Infrastructure Engineering in Glasgow

Infrastructure Engineering
Co-occurring Skills and Capabilities in Glasgow by Category

The follow tables expand on the table above by listing co-occurrences grouped by category. The same employment type, locality and period is covered with up to 20 co-occurrences shown in each of the following categories:

Application Platforms
1 3 (16.67%) SharePoint
2 2 (11.11%) IIS
2 2 (11.11%) Microsoft Exchange
3 1 (5.56%) WinCC
Cloud Services
1 8 (44.44%) Azure
2 4 (22.22%) GCP
3 2 (11.11%) AWS
3 2 (11.11%) Entra ID
3 2 (11.11%) Microsoft 365
Communications & Networking
1 5 (27.78%) Firewall
2 4 (22.22%) DHCP
2 4 (22.22%) DNS
3 2 (11.11%) TCP/IP
3 2 (11.11%) VPN
4 1 (5.56%) Modbus
General
1 4 (22.22%) Finance
1 4 (22.22%) Inclusion and Diversity
1 4 (22.22%) Law
1 4 (22.22%) Marketing
2 2 (11.11%) Manufacturing
2 2 (11.11%) Social Skills
3 1 (5.56%) Military
Job Titles
1 14 (77.78%) Infrastructure Engineer
2 5 (27.78%) Lead
3 4 (22.22%) Cloud Engineer
3 4 (22.22%) Cloud Infrastructure Engineer
3 4 (22.22%) Lead Cloud Engineer
3 4 (22.22%) Lead Infrastructure Engineer
4 3 (16.67%) IT Engineer
4 3 (16.67%) IT Security Engineer
4 3 (16.67%) Security Engineer
5 2 (11.11%) Network Engineer
5 2 (11.11%) Network Infrastructure Engineer
5 2 (11.11%) Senior
5 2 (11.11%) Senior Infrastructure Engineer
6 1 (5.56%) Team Leader
Libraries, Frameworks & Software Standards
1 4 (22.22%) OLE
Miscellaneous
1 4 (22.22%) Private Cloud
2 3 (16.67%) Distributed Denial-of-Service
2 3 (16.67%) Driving Licence
2 3 (16.67%) Management Information System
3 2 (11.11%) Cyber Security Posture
3 2 (11.11%) Legacy Systems
3 2 (11.11%) Onboarding
3 2 (11.11%) Operational Technology
3 2 (11.11%) Renewable Energy
3 2 (11.11%) Security Posture
4 1 (5.56%) SCADA
Operating Systems
1 7 (38.89%) Windows
1 7 (38.89%) Windows Server
2 2 (11.11%) Linux
2 2 (11.11%) Unix
3 1 (5.56%) Windows 10
3 1 (5.56%) Windows Server 2016
3 1 (5.56%) Windows Server 2019
Processes & Methodologies
1 10 (55.56%) Problem-Solving
2 4 (22.22%) Deployment Automation
3 3 (16.67%) Application Security
3 3 (16.67%) DevSecOps
3 3 (16.67%) Identity Access Management
3 3 (16.67%) Incident Management
3 3 (16.67%) Information Security
3 3 (16.67%) ITIL
3 3 (16.67%) Malware Detection/Protection
3 3 (16.67%) Project Delivery
3 3 (16.67%) Risk Management
3 3 (16.67%) SIEM
3 3 (16.67%) SOAR
3 3 (16.67%) Use Case
3 3 (16.67%) Vulnerability Management
3 3 (16.67%) Vulnerability Scanning
4 2 (11.11%) Cybersecurity
4 2 (11.11%) Kalman Filter
4 2 (11.11%) Migration
4 2 (11.11%) Stakeholder Engagement
Programming Languages
1 4 (22.22%) Python
2 2 (11.11%) PowerShell
2 2 (11.11%) SQL
Qualifications
1 4 (22.22%) Azure Certification
1 4 (22.22%) DV Cleared
1 4 (22.22%) Security Cleared
2 2 (11.11%) Network+ Certification
Quality Assurance & Compliance
1 5 (27.78%) ISO/IEC 27001
1 5 (27.78%) NIST
2 3 (16.67%) NCSC
2 3 (16.67%) SOC 2
3 2 (11.11%) Cyber Essentials
3 2 (11.11%) Cyber Essentials PLUS
4 1 (5.56%) IEC 61131
4 1 (5.56%) IEC 61508
4 1 (5.56%) QA
System Software
1 5 (27.78%) VMware Infrastructure
2 4 (22.22%) Hyper-V
3 3 (16.67%) Active Directory
4 1 (5.56%) vSphere
Systems Management
1 4 (22.22%) Kubernetes
1 4 (22.22%) Microsoft Intune
1 4 (22.22%) Terraform
2 2 (11.11%) FortiGate
2 2 (11.11%) Proxmox
Vendors
1 5 (27.78%) Microsoft
1 5 (27.78%) VMware
2 3 (16.67%) Cisco
3 2 (11.11%) Fortinet
4 1 (5.56%) Juniper
4 1 (5.56%) McAfee
4 1 (5.56%) NetApp
4 1 (5.56%) Rockwell
4 1 (5.56%) Siemens
4 1 (5.56%) Splunk