Developed Vetting (DV) Clearance
North West > Manchester
The table below provides summary statistics for permanent job vacancies advertised in Manchester with a requirement for DV Cleared qualifications. It includes a benchmarking guide to the salaries offered over the 6 months leading up to 12 January 2026, comparing them to the same period in the previous two years.
| 6 months to 12 Jan 2026 |
Same period 2025 | Same period 2024 | |
|---|---|---|---|
| Rank | 100 | 105 | 82 |
| Rank change year-on-year | +5 | -23 | +126 |
| Permanent jobs citing DV Cleared | 30 | 47 | 66 |
| As % of all permanent jobs in Manchester | 1.04% | 1.77% | 2.59% |
| As % of the Qualifications category | 3.07% | 5.06% | 11.26% |
| Number of salaries quoted | 26 | 13 | 31 |
| 10th Percentile | £52,500 | - | £47,500 |
| 25th Percentile | £61,250 | £52,500 | £56,250 |
| Median annual salary (50th Percentile) | £75,000 | £60,000 | £62,500 |
| Median % change year-on-year | +25.00% | -4.00% | +4.17% |
| 75th Percentile | £84,375 | £71,250 | £75,625 |
| 90th Percentile | £95,000 | £78,000 | £82,500 |
| North West median annual salary | £75,000 | £60,000 | £61,500 |
| % change year-on-year | +25.00% | -2.44% | +2.50% |
All Academic and Professional Certifications
Manchester
DV Cleared falls under the Academic Qualifications and Professional Certifications category. For comparison with the information above, the following table provides summary statistics for all permanent job vacancies requiring academic qualifications or professional certifications in Manchester.
| Permanent vacancies requiring academic qualifications or professional certifications | 976 | 929 | 586 |
| As % of all permanent jobs advertised in Manchester | 33.98% | 34.92% | 23.01% |
| Number of salaries quoted | 335 | 388 | 407 |
| 10th Percentile | £24,500 | £30,000 | £37,408 |
| 25th Percentile | £28,500 | £40,000 | £45,000 |
| Median annual salary (50th Percentile) | £50,000 | £55,000 | £57,500 |
| Median % change year-on-year | -9.09% | -4.35% | - |
| 75th Percentile | £67,500 | £68,750 | £71,841 |
| 90th Percentile | £83,250 | £80,375 | £82,500 |
| North West median annual salary | £48,450 | £50,055 | £52,500 |
| % change year-on-year | -3.21% | -4.66% | -4.55% |
DV Cleared
Job Vacancy Trend in Manchester
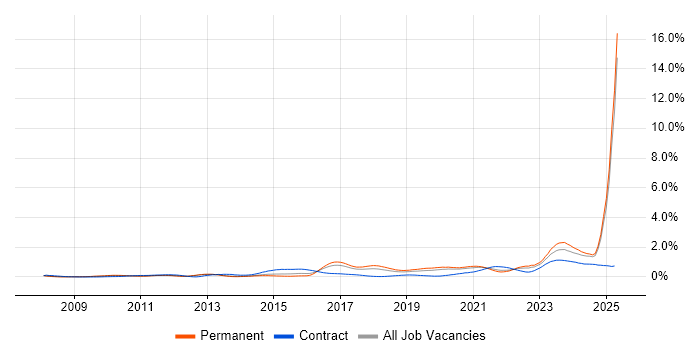
Historical trend showing the proportion of permanent IT job postings citing DV Cleared relative to all permanent IT jobs advertised in Manchester.

DV Cleared
Salary Trend in Manchester
Salary distribution trend for jobs in Manchester citing DV Cleared.

DV Cleared
Salary Histogram in Manchester
Salary distribution for jobs citing DV Cleared in Manchester over the 6 months to 12 January 2026.
DV Cleared
Co-Occurring Skills & Capabilities in Manchester by Category
The following tables expand on the one above by listing co-occurrences grouped by category. They cover the same employment type, locality and period, with up to 20 co-occurrences shown in each category:
|
|
||||||||||||||||||||||||||||||||||||||||||||||||||||||||||||||||||||||||||||||||||||||||||||||||||||||||||||||||||||||||
|
|
||||||||||||||||||||||||||||||||||||||||||||||||||||||||||||||||||||||||||||||||||||||||||||||||||||||||||||||||||||||||
|
|
||||||||||||||||||||||||||||||||||||||||||||||||||||||||||||||||||||||||||||||||||||||||||||||||||||||||||||||||||||||||
|
|
||||||||||||||||||||||||||||||||||||||||||||||||||||||||||||||||||||||||||||||||||||||||||||||||||||||||||||||||||||||||
|
|
||||||||||||||||||||||||||||||||||||||||||||||||||||||||||||||||||||||||||||||||||||||||||||||||||||||||||||||||||||||||
|
|
||||||||||||||||||||||||||||||||||||||||||||||||||||||||||||||||||||||||||||||||||||||||||||||||||||||||||||||||||||||||
|
|
||||||||||||||||||||||||||||||||||||||||||||||||||||||||||||||||||||||||||||||||||||||||||||||||||||||||||||||||||||||||
|
|
||||||||||||||||||||||||||||||||||||||||||||||||||||||||||||||||||||||||||||||||||||||||||||||||||||||||||||||||||||||||
|
|||||||||||||||||||||||||||||||||||||||||||||||||||||||||||||||||||||||||||||||||||||||||||||||||||||||||||||||||||||||||
