Tableau Job Trends in the Midlands

Tableau
England > Midlands

The table below provides summary statistics and salary benchmarking for jobs advertised in the Midlands requiring Tableau skills. It covers permanent job vacancies from the 6 months leading up to 6 November 2025, with comparisons to the same periods in the previous two years.

6 months to
6 Nov 2025
Same period 2024 Same period 2023
Rank 162 221 143
Rank change year-on-year +59 -78 -27
Permanent jobs citing Tableau 53 44 90
As % of all permanent jobs in the Midlands 0.95% 0.50% 1.79%
As % of the Database & Business Intelligence category 7.93% 4.90% 8.88%
Number of salaries quoted 47 19 72
10th Percentile £35,000 £38,750 £29,200
25th Percentile £37,500 £41,250 £37,188
Median annual salary (50th Percentile) £40,000 £65,000 £43,000
Median % change year-on-year -38.46% +51.16% -6.97%
75th Percentile £46,875 £67,500 £55,531
90th Percentile £61,500 £67,750 £62,500
England median annual salary £52,500 £65,000 £60,000
% change year-on-year -19.23% +8.33% +9.09%

All Database and Business Intelligence Skills
Midlands

Tableau falls under the Databases and Business Intelligence category. For comparison with the information above, the following table provides summary statistics for all permanent job vacancies requiring database or business intelligence skills in the Midlands.

Permanent vacancies with a requirement for database or business intelligence skills 668 898 1,013
As % of all permanent jobs advertised in the Midlands 11.95% 10.13% 20.10%
Number of salaries quoted 506 493 883
10th Percentile £33,500 £32,500 £33,500
25th Percentile £40,000 £41,250 £41,625
Median annual salary (50th Percentile) £52,500 £50,500 £52,500
Median % change year-on-year +3.96% -3.81% -
75th Percentile £68,750 £65,000 £65,000
90th Percentile £74,375 £75,000 £73,750
England median annual salary £60,000 £65,000 £61,799
% change year-on-year -7.69% +5.18% -1.12%

Tableau
Job Vacancy Trend in the Midlands

Historical trend showing the proportion of permanent IT job postings citing Tableau relative to all permanent IT jobs advertised in the Midlands.
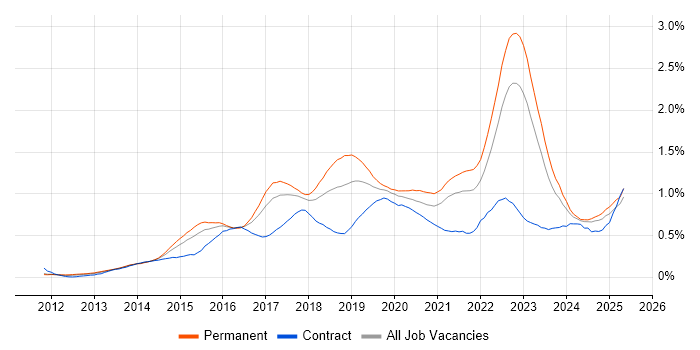
Tableau job vacancy trend in the Midlands

Tableau
Salary Trend in the Midlands

Salary distribution trend for jobs in the Midlands citing Tableau.

Salary distribution trend for jobs in the Midlands citing Tableau

Tableau
Salary Histogram in the Midlands

Salary distribution for jobs citing Tableau in the Midlands over the 6 months to 6 November 2025.

Salary histogram for Tableau in the Midlands

Tableau
Job Locations in the Midlands

The table below looks at the demand and provides a guide to the median salaries quoted in IT jobs citing Tableau within the Midlands region over the 6 months to 6 November 2025. The 'Rank Change' column provides an indication of the change in demand within each location based on the same 6 month period last year.

Location Rank Change
on Same Period
Last Year
Matching
Permanent
IT Job Ads
Median Salary
Past 6 Months
Median Salary
% Change
on Same Period
Last Year
Live
Jobs
East Midlands +34 28 £40,000 -13.51% 47
West Midlands +52 25 £42,500 -34.62% 72
Tableau
England

Tableau
Co-Occurring Skills & Capabilities in the Midlands by Category

The following tables expand on the one above by listing co-occurrences grouped by category. They cover the same employment type, locality and period, with up to 20 co-occurrences shown in each category:

Application Platforms
1 1 (1.89%) Apache Airflow
1 1 (1.89%) Apache Spark
1 1 (1.89%) Confluence
1 1 (1.89%) SAS
Applications
1 23 (43.40%) Microsoft Excel
2 1 (1.89%) Microsoft Office
2 1 (1.89%) MS Visio
Cloud Services
1 35 (66.04%) Power Platform
2 6 (11.32%) Azure
3 4 (7.55%) AWS
3 4 (7.55%) GCP
4 3 (5.66%) SaaS
5 2 (3.77%) Azure DevOps
5 2 (3.77%) Salesforce Sales Cloud
6 1 (1.89%) Amazon CloudWatch
6 1 (1.89%) Azure Data Factory
6 1 (1.89%) Cloud Computing
6 1 (1.89%) Datadog
6 1 (1.89%) GitHub
6 1 (1.89%) PowerApps
6 1 (1.89%) Snowflake
Communications & Networking
1 1 (1.89%) Broadband
1 1 (1.89%) PuTTY
Database & Business Intelligence
1 35 (66.04%) Power BI
2 10 (18.87%) BigQuery
3 8 (15.09%) Data Mining
4 4 (7.55%) SQL Server
5 3 (5.66%) BusinessObjects
5 3 (5.66%) Data Warehouse
5 3 (5.66%) MySQL
6 2 (3.77%) Crystal Reports
6 2 (3.77%) Data Lake
7 1 (1.89%) Amazon Athena
7 1 (1.89%) Hadoop
7 1 (1.89%) Looker
7 1 (1.89%) Metadata
7 1 (1.89%) Metadata Repository
7 1 (1.89%) PostgreSQL
7 1 (1.89%) Qlik Sense
7 1 (1.89%) QlikView
7 1 (1.89%) Spark SQL
7 1 (1.89%) SQL Server Reporting Services
7 1 (1.89%) SQLite
Development Applications
1 2 (3.77%) JIRA
2 1 (1.89%) Git
General
1 23 (43.40%) Finance
2 21 (39.62%) Analytical Skills
3 14 (26.42%) Marketing
4 11 (20.75%) Social Skills
5 9 (16.98%) Documentation Skills
6 4 (7.55%) Public Sector
6 4 (7.55%) Social Housing
7 2 (3.77%) Inclusion and Diversity
7 2 (3.77%) Law
7 2 (3.77%) Retail
Job Titles
1 30 (56.60%) Analyst
2 28 (52.83%) Data Analyst
3 14 (26.42%) Developer
4 11 (20.75%) Business Intelligence Developer
5 10 (18.87%) Customer Analyst
5 10 (18.87%) Digital Analyst
5 10 (18.87%) Digital Analytics Analyst
6 9 (16.98%) Data Quality Analyst
6 9 (16.98%) Quality Analyst
7 8 (15.09%) Analyst Developer
7 8 (15.09%) Analytics Developer
7 8 (15.09%) Business Intelligence Analyst
7 8 (15.09%) Business Intelligence Data Analyst
7 8 (15.09%) Digital Analytics Developer
7 8 (15.09%) Digital Developer
8 6 (11.32%) Trainee
9 5 (9.43%) Trainee Analyst
9 5 (9.43%) Trainee Data Analyst
10 4 (7.55%) Senior
11 3 (5.66%) Data Engineer
Libraries, Frameworks & Software Standards
1 2 (3.77%) JSON
1 2 (3.77%) XML
2 1 (1.89%) Apache NiFi
2 1 (1.89%) Kafka
2 1 (1.89%) Plotly
2 1 (1.89%) PySpark
2 1 (1.89%) Regular Expression
2 1 (1.89%) Shiny
Miscellaneous
1 2 (3.77%) Product Ownership
2 1 (1.89%) Analytical Mindset
2 1 (1.89%) Credit Risk
2 1 (1.89%) Data Structures
2 1 (1.89%) Enterprise Software
2 1 (1.89%) Legacy Applications
2 1 (1.89%) Management Information System
2 1 (1.89%) Onboarding
2 1 (1.89%) Self-Motivation
2 1 (1.89%) Social Media
Operating Systems
1 1 (1.89%) Unix
Processes & Methodologies
1 36 (67.92%) Visualisation
2 33 (62.26%) Business Intelligence
2 33 (62.26%) Data Visualisation
3 30 (56.60%) Analytics
4 21 (39.62%) Decision-Making
5 19 (35.85%) Continuous Improvement
6 17 (32.08%) Data Science
7 15 (28.30%) CRM
7 15 (28.30%) Data Analysis
8 14 (26.42%) Statistical Analysis
9 13 (24.53%) Problem-Solving
10 12 (22.64%) A/B Testing
10 12 (22.64%) Economics
10 12 (22.64%) Statistics
10 12 (22.64%) Validation
11 11 (20.75%) Customer Acquisition
11 11 (20.75%) Data Governance
11 11 (20.75%) Lead Generation
11 11 (20.75%) Project Management
12 10 (18.87%) Actionable Insight
Programming Languages
1 46 (86.79%) SQL
2 34 (64.15%) Python
3 4 (7.55%) R
4 2 (3.77%) T-SQL
5 1 (1.89%) Bash
5 1 (1.89%) Java
5 1 (1.89%) PowerShell
5 1 (1.89%) PROC SQL
Qualifications
1 15 (28.30%) Degree
2 10 (18.87%) Numerate Degree
3 2 (3.77%) Computer Science Degree
4 1 (1.89%) AWS Certification
4 1 (1.89%) Azure Certification
4 1 (1.89%) Chartered Engineer
4 1 (1.89%) SC Cleared
4 1 (1.89%) Security Cleared
4 1 (1.89%) Six Sigma Yellow Belt
Quality Assurance & Compliance
1 14 (26.42%) Data Quality
2 3 (5.66%) QA
3 1 (1.89%) COSHH
3 1 (1.89%) GDPR
3 1 (1.89%) SLA
System Software
1 1 (1.89%) Apache Flume
1 1 (1.89%) HDFS
Systems Management
1 1 (1.89%) Kibana
1 1 (1.89%) logstash
1 1 (1.89%) Oozie
Vendors
1 14 (26.42%) Salesforce
2 7 (13.21%) Microsoft
3 3 (5.66%) Databricks
4 2 (3.77%) Salesforce Marketing Cloud
5 1 (1.89%) Alteryx
5 1 (1.89%) Autodesk
5 1 (1.89%) BT
5 1 (1.89%) Google
5 1 (1.89%) Informatica
5 1 (1.89%) MicroStrategy
5 1 (1.89%) Sage
5 1 (1.89%) SAP