Retail Jobs in the Midlands

Retailing
England > Midlands

The table below looks at the prevalence of the term Retail in permanent job vacancies in the Midlands. Included is a benchmarking guide to the salaries offered in vacancies that cited Retail over the 6 months leading up to 23 October 2024, comparing them to the same period in the previous two years.

6 months to
23 Oct 2024
Same period 2023 Same period 2022
Rank 11 28 64
Rank change year-on-year +17 +36 -38
Permanent jobs citing Retail 916 398 494
As % of all permanent jobs advertised in the Midlands 9.81% 7.09% 4.41%
As % of the General category 17.93% 10.63% 6.44%
Number of salaries quoted 199 290 376
10th Percentile £27,000 - £34,500
25th Percentile £32,500 £26,500 £45,000
Median annual salary (50th Percentile) £47,500 £40,000 £52,500
Median % change year-on-year +18.75% -23.81% +5.00%
75th Percentile £63,000 £56,438 £72,500
90th Percentile £78,750 £68,875 £85,000
England median annual salary £50,000 £57,500 £60,000
% change year-on-year -13.04% -4.17% +4.35%

All General Skills
Midlands

Retail falls under the General Skills category. For comparison with the information above, the following table provides summary statistics for all permanent job vacancies requiring common skills in the Midlands.

Permanent vacancies with a requirement for common skills 5,110 3,743 7,674
As % of all permanent jobs advertised in the Midlands 54.73% 66.65% 68.51%
Number of salaries quoted 2,033 2,680 4,271
10th Percentile £30,000 £26,500 £28,565
25th Percentile £37,000 £33,622 £37,500
Median annual salary (50th Percentile) £50,000 £50,000 £50,000
Median % change year-on-year - - +5.26%
75th Percentile £65,000 £63,750 £63,750
90th Percentile £77,500 £76,250 £77,500
England median annual salary £60,000 £60,000 £60,000
% change year-on-year - - +2.56%

Retail
Job Vacancy Trend in the Midlands

Job postings citing Retail as a proportion of all IT jobs advertised in the Midlands.
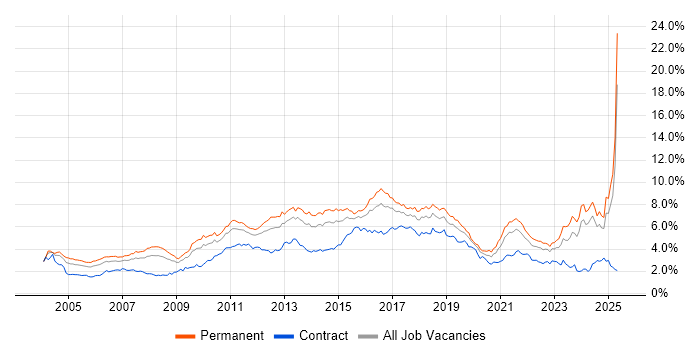
Job vacancy trend for Retail in the Midlands

Retail
Salary Trend in the Midlands

3-month moving average salary quoted in jobs citing Retail in the Midlands.

Salary trend for Retail in the Midlands

Retail
Salary Histogram in the Midlands

Salary distribution for jobs citing Retail in the Midlands over the 6 months to 23 October 2024.

Salary histogram for Retail in the Midlands

Retail
Job Locations in the Midlands

The table below looks at the demand and provides a guide to the median salaries quoted in IT jobs citing Retail within the Midlands region over the 6 months to 23 October 2024. The 'Rank Change' column provides an indication of the change in demand within each location based on the same 6 month period last year.

Location Rank Change
on Same Period
Last Year
Matching
Permanent
IT Job Ads
Median Salary
Past 6 Months
Median Salary
% Change
on Same Period
Last Year
Live
Jobs
West Midlands +16 481 £45,000 +26.32% 190
East Midlands +13 434 £55,000 +52.78% 247
Retail
England

Retail
Co-occurring Skills and Capabilities in the Midlands by Category

The follow tables expand on the table above by listing co-occurrences grouped by category. The same employment type, locality and period is covered with up to 20 co-occurrences shown in each of the following categories:

Application Platforms
1 8 (0.87%) Microsoft Exchange
2 7 (0.76%) Confluence
3 5 (0.55%) SharePoint
4 2 (0.22%) CMS
5 1 (0.11%) BizTalk Server
5 1 (0.11%) Headless CMS
5 1 (0.11%) IIS
5 1 (0.11%) Strapi
5 1 (0.11%) WordPress
Applications
1 347 (37.88%) Microsoft Office
2 345 (37.66%) Microsoft Excel
3 86 (9.39%) Microsoft PowerPoint
4 7 (0.76%) Trello
5 6 (0.66%) MS Visio
6 3 (0.33%) Adobe Creative Suite
7 1 (0.11%) Photoshop
7 1 (0.11%) Spreadsheet
Business Applications
1 7 (0.76%) Magento
2 6 (0.66%) ResourceLink
3 4 (0.44%) Dynamics CRM
4 3 (0.33%) Oracle Payables
5 2 (0.22%) Dynamics NAV
5 2 (0.22%) Sage 200
5 2 (0.22%) SAP EWM
5 2 (0.22%) SAP S/4HANA
6 1 (0.11%) Avolution ABACUS
6 1 (0.11%) Oracle Assets
6 1 (0.11%) Oracle Cash Management
6 1 (0.11%) Oracle General Ledger
6 1 (0.11%) Oracle Receivables
6 1 (0.11%) Payment Gateway
6 1 (0.11%) SAP HR
Cloud Services
1 44 (4.80%) Azure
2 33 (3.60%) Microsoft 365
3 21 (2.29%) AWS
3 21 (2.29%) Google Docs
3 21 (2.29%) Google Sheets
4 20 (2.18%) Google Workspace
5 17 (1.86%) SaaS
6 15 (1.64%) Power Platform
7 14 (1.53%) Entra ID
8 7 (0.76%) GCP
9 6 (0.66%) Cloud Computing
9 6 (0.66%) PaaS
9 6 (0.66%) SuccessFactors
10 5 (0.55%) Azure Stack
11 4 (0.44%) Cohesity
11 4 (0.44%) Dynamics 365
11 4 (0.44%) IaaS
11 4 (0.44%) OneDrive
12 3 (0.33%) Serverless
13 2 (0.22%) Amazon GuardDuty
Communications & Networking
1 32 (3.49%) Firewall
2 28 (3.06%) DNS
3 24 (2.62%) DHCP
4 23 (2.51%) BGP
4 23 (2.51%) OSPF
4 23 (2.51%) VLAN
5 20 (2.18%) TCP/IP
6 19 (2.07%) WLAN
7 18 (1.97%) VoIP
8 17 (1.86%) Wi-Fi
9 15 (1.64%) Broadband
10 13 (1.42%) Ethernet
11 9 (0.98%) VPN
12 8 (0.87%) Network Security
13 4 (0.44%) EIGRP
13 4 (0.44%) FTP
13 4 (0.44%) SSL
13 4 (0.44%) WAN
14 3 (0.33%) IPsec
14 3 (0.33%) SAN
Database & Business Intelligence
1 24 (2.62%) SQL Server
2 15 (1.64%) Power BI
3 11 (1.20%) Tableau
4 7 (0.76%) SQL Server Integration Services
5 5 (0.55%) MySQL
6 3 (0.33%) Data Warehouse
7 2 (0.22%) Amazon RDS
7 2 (0.22%) NoSQL
7 2 (0.22%) PostgreSQL
7 2 (0.22%) SQL Server Reporting Services
7 2 (0.22%) UniData
8 1 (0.11%) Apache Hive
8 1 (0.11%) Azure SQL Database
8 1 (0.11%) Big Data
8 1 (0.11%) BusinessObjects
8 1 (0.11%) DB2
8 1 (0.11%) Hadoop
8 1 (0.11%) MariaDB
8 1 (0.11%) Power Query
8 1 (0.11%) SAP BW
Development Applications
1 17 (1.86%) JIRA
2 11 (1.20%) Git
3 3 (0.33%) GitLab
4 2 (0.22%) Burp Suite
4 2 (0.22%) Jenkins
4 2 (0.22%) Metasploit
4 2 (0.22%) sqlmap
5 1 (0.11%) Team Foundation Server
5 1 (0.11%) Visual Studio
General
1 350 (38.21%) Social Skills
2 347 (37.88%) Finance
3 302 (32.97%) Analytical Skills
4 229 (25.00%) Marketing
5 178 (19.43%) Legal
6 137 (14.96%) Presentation Skills
7 42 (4.59%) Inclusion and Diversity
8 38 (4.15%) Manufacturing
9 34 (3.71%) Automotive
10 13 (1.42%) Influencing Skills
11 12 (1.31%) Banking
12 11 (1.20%) Public Sector
13 8 (0.87%) Organisational Skills
14 7 (0.76%) Wholesale Banking
15 6 (0.66%) Pharmaceutical
16 3 (0.33%) Law
17 2 (0.22%) Documentation Skills
17 2 (0.22%) Electronics
17 2 (0.22%) Retail Banking
17 2 (0.22%) Telecoms
Job Titles
1 246 (26.86%) Development Manager
2 168 (18.34%) Analyst
3 77 (8.41%) Business Analyst
4 71 (7.75%) Business Manager
5 62 (6.77%) Business Development Manager
5 62 (6.77%) Lead
6 45 (4.91%) Project Manager
7 43 (4.69%) Architect
8 42 (4.59%) Developer
9 41 (4.48%) Senior
10 37 (4.04%) Systems Engineer
11 36 (3.93%) Data Analyst
11 36 (3.93%) Lead Business Analyst
11 36 (3.93%) Solutions Architect
11 36 (3.93%) Team Leader
12 34 (3.71%) Business Analyst Team Leader
13 32 (3.49%) IT Manager
14 24 (2.62%) IT Engineer
15 22 (2.40%) Network Engineer
16 21 (2.29%) Programme Manager
Libraries, Frameworks & Software Standards
1 23 (2.51%) HTML
2 19 (2.07%) CSS
3 13 (1.42%) .NET
3 13 (1.42%) AngularJS
4 9 (0.98%) .NET Framework
4 9 (0.98%) Ajax
4 9 (0.98%) React
4 9 (0.98%) REST
4 9 (0.98%) SOAP
4 9 (0.98%) Twitter Bootstrap
4 9 (0.98%) Web Services
4 9 (0.98%) XML
5 6 (0.66%) .NET Core
6 5 (0.55%) jQuery
6 5 (0.55%) JSON
6 5 (0.55%) Next.js
7 4 (0.44%) Vue
8 3 (0.33%) Laravel
8 3 (0.33%) Node.js
8 3 (0.33%) Ruby on Rails
Miscellaneous
1 119 (12.99%) Onboarding
2 37 (4.04%) Management Information System
3 28 (3.06%) Driving Licence
4 20 (2.18%) Self-Motivation
5 19 (2.07%) FMCG
5 19 (2.07%) Smartphone
6 14 (1.53%) Analytical Mindset
7 13 (1.42%) Product Ownership
8 11 (1.20%) Greenfield Project
9 8 (0.87%) Pricing Data
10 7 (0.76%) Credit Risk
11 6 (0.66%) Data Centre
11 6 (0.66%) EPoS
11 6 (0.66%) PMI
11 6 (0.66%) Virtual Team
12 5 (0.55%) Mobile App
13 4 (0.44%) CMDB
13 4 (0.44%) Culture of Ownership
13 4 (0.44%) Cyber Threat
13 4 (0.44%) Data Protection Act
Operating Systems
1 48 (5.24%) Windows
2 32 (3.49%) Linux
2 32 (3.49%) Windows Server
3 22 (2.40%) Windows Server 2016
3 22 (2.40%) Windows Server 2019
4 20 (2.18%) Windows 10
5 19 (2.07%) Mac OS X
5 19 (2.07%) Ubuntu
6 4 (0.44%) Unix
7 3 (0.33%) Windows Server 2008
7 3 (0.33%) Windows Server 2012
8 2 (0.22%) Apple iOS
8 2 (0.22%) SUSE
9 1 (0.11%) Android
9 1 (0.11%) VMS
Processes & Methodologies
1 403 (44.00%) Logistics
2 298 (32.53%) Business Development
3 245 (26.75%) Agile
4 221 (24.13%) Financial Modelling
5 219 (23.91%) Commercial Awareness
5 219 (23.91%) Customer Requirements
5 219 (23.91%) Data Management
5 219 (23.91%) Facilities Management
5 219 (23.91%) Problem-Solving
6 217 (23.69%) CAD
7 158 (17.25%) Data Analysis
8 153 (16.70%) Mentoring
9 147 (16.05%) Customer Service
10 136 (14.85%) Mathematics
11 115 (12.55%) Mechatronics
12 106 (11.57%) ITIL
13 101 (11.03%) Business Analysis
14 99 (10.81%) Resource Allocation
15 91 (9.93%) Coaching
16 85 (9.28%) Disaster Recovery
Programming Languages
1 91 (9.93%) SQL
2 31 (3.38%) PowerShell
3 25 (2.73%) Python
4 19 (2.07%) JavaScript
5 15 (1.64%) C#
6 10 (1.09%) Java
7 8 (0.87%) TypeScript
8 7 (0.76%) C++
8 7 (0.76%) PHP
9 6 (0.66%) C
9 6 (0.66%) PL/SQL
10 5 (0.55%) T-SQL
11 3 (0.33%) Bicep
11 3 (0.33%) Ruby
12 1 (0.11%) Data Analysis Expressions
12 1 (0.11%) RPG
12 1 (0.11%) VB.NET
Qualifications
1 278 (30.35%) Degree
2 135 (14.74%) HNC
3 42 (4.59%) Computer Science Degree
4 30 (3.28%) Microsoft Certification
5 21 (2.29%) MCSE
6 20 (2.18%) HND
7 13 (1.42%) DBS Check
8 7 (0.76%) MCSA
9 6 (0.66%) CISSP
9 6 (0.66%) PMI Certification
10 5 (0.55%) Azure Certification
10 5 (0.55%) CCNP
10 5 (0.55%) CISA
10 5 (0.55%) Cisco Certification
10 5 (0.55%) CISM
11 4 (0.44%) Network+ Certification
11 4 (0.44%) PMP
12 3 (0.33%) BPSS Clearance
12 3 (0.33%) ITIL Foundation Certificate
12 3 (0.33%) MRICS
Quality Assurance & Compliance
1 83 (9.06%) QA
2 12 (1.31%) PMO
2 12 (1.31%) SLA
3 10 (1.09%) ISO/IEC 27001
4 7 (0.76%) Data Quality
5 6 (0.66%) GDPR
6 4 (0.44%) PCI DSS
7 2 (0.22%) IFRS
7 2 (0.22%) IFRS 9
7 2 (0.22%) NIST
8 1 (0.11%) Accessibility
System Software
1 42 (4.59%) Active Directory
2 13 (1.42%) VMware Infrastructure
3 6 (0.66%) Docker
4 5 (0.55%) Hyper-V
5 4 (0.44%) VMware Workstation
6 3 (0.33%) Firmware
7 2 (0.22%) Microsoft Virtual Server
7 2 (0.22%) Varnish
7 2 (0.22%) Virtual Servers
8 1 (0.11%) Terminal Services
Systems Management
1 6 (0.66%) SCCM
1 6 (0.66%) SCOM
2 5 (0.55%) Single Sign-On
3 3 (0.33%) Kubernetes
3 3 (0.33%) Terraform
4 2 (0.22%) Failover Clustering
5 1 (0.11%) FortiGate
5 1 (0.11%) Microsoft Intune
Vendors
1 407 (44.43%) Microsoft
2 55 (6.00%) Google
3 27 (2.95%) Cisco
4 24 (2.62%) Dell
5 22 (2.40%) Apple
6 21 (2.29%) Planview
7 19 (2.07%) Fortinet
7 19 (2.07%) Ubiquiti
8 18 (1.97%) SAP
9 13 (1.42%) VMware
10 10 (1.09%) Adobe
11 9 (0.98%) Citrix
11 9 (0.98%) Databricks
12 8 (0.87%) BT
12 8 (0.87%) HP
12 8 (0.87%) IBM
12 8 (0.87%) Oracle
12 8 (0.87%) ServiceNow
13 7 (0.76%) Atlassian
13 7 (0.76%) New Relic