AI Job Trends in the Midlands

AI
England > Midlands

The table below provides summary statistics and salary benchmarking for jobs advertised in the Midlands requiring AI skills. It covers permanent job vacancies from the 6 months leading up to 22 November 2025, with comparisons to the same periods in the previous two years.

6 months to
22 Nov 2025
Same period 2024 Same period 2023
Rank 12 139 155
Rank change year-on-year +127 +16 +21
Permanent jobs citing AI 541 150 76
As % of all permanent jobs in the Midlands 9.08% 1.68% 1.50%
As % of the Processes & Methodologies category 11.05% 2.02% 1.62%
Number of salaries quoted 118 86 34
10th Percentile £35,000 £37,500 £27,900
25th Percentile £47,813 £50,000 £45,000
Median annual salary (50th Percentile) £65,000 £77,000 £65,000
Median % change year-on-year -15.58% +18.46% +4.00%
75th Percentile £87,188 £96,250 £78,750
90th Percentile £100,000 £110,000 £100,000
England median annual salary £70,000 £77,000 £76,383
% change year-on-year -9.09% +0.81% +9.12%

All Process and Methodology Skills
Midlands

AI falls under the Processes and Methodologies category. For comparison with the information above, the following table provides summary statistics for all permanent job vacancies requiring process or methodology skills in the Midlands.

Permanent vacancies with a requirement for process or methodology skills 4,895 7,411 4,702
As % of all permanent jobs advertised in the Midlands 82.13% 82.85% 93.11%
Number of salaries quoted 3,274 3,351 3,623
10th Percentile £27,000 £30,000 £27,000
25th Percentile £32,500 £38,750 £36,610
Median annual salary (50th Percentile) £47,500 £52,398 £50,000
Median % change year-on-year -9.35% +4.80% -2.91%
75th Percentile £65,000 £66,967 £63,750
90th Percentile £80,000 £80,000 £77,500
England median annual salary £55,000 £60,000 £60,000
% change year-on-year -8.33% - -1.64%

AI
Job Vacancy Trend in the Midlands

Historical trend showing the proportion of permanent IT job postings citing AI relative to all permanent IT jobs advertised in the Midlands.
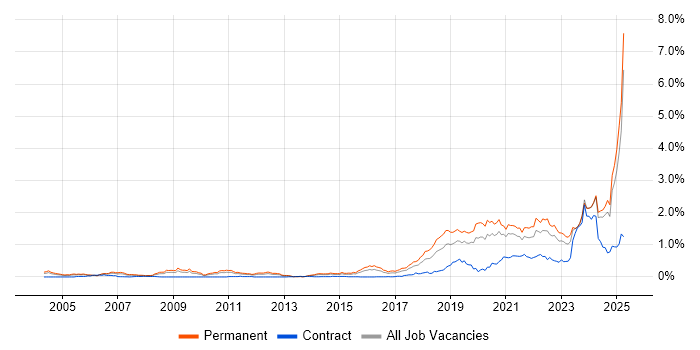
AI job vacancy trend in the Midlands

AI
Salary Trend in the Midlands

Salary distribution trend for jobs in the Midlands citing AI.

Salary distribution trend for jobs in the Midlands citing AI

AI
Salary Histogram in the Midlands

Salary distribution for jobs citing AI in the Midlands over the 6 months to 22 November 2025.

Salary histogram for AI in the Midlands

AI
Job Locations in the Midlands

The table below looks at the demand and provides a guide to the median salaries quoted in IT jobs citing AI within the Midlands region over the 6 months to 22 November 2025. The 'Rank Change' column provides an indication of the change in demand within each location based on the same 6 month period last year.

Location Rank Change
on Same Period
Last Year
Matching
Permanent
IT Job Ads
Median Salary
Past 6 Months
Median Salary
% Change
on Same Period
Last Year
Live
Jobs
West Midlands +110 334 £65,000 - 177
East Midlands +96 205 £60,000 -29.41% 64
AI
England

AI
Co-Occurring Skills & Capabilities in the Midlands by Category

The following tables expand on the one above by listing co-occurrences grouped by category. They cover the same employment type, locality and period, with up to 20 co-occurrences shown in each category:

Application Platforms
1 8 (1.48%) Apache Spark
1 8 (1.48%) CMS
2 7 (1.29%) SharePoint
3 5 (0.92%) Apache
4 3 (0.55%) Apache Airflow
5 2 (0.37%) SAS
5 2 (0.37%) Umbraco
6 1 (0.18%) WordPress
Applications
1 285 (52.68%) Chatbot
2 13 (2.40%) Microsoft Excel
3 4 (0.74%) Microsoft Office
4 3 (0.55%) InDesign
5 1 (0.18%) Spreadsheet
Business Applications
1 18 (3.33%) Dynamics CRM
2 4 (0.74%) Shopify
3 3 (0.55%) SAP Business One
4 1 (0.18%) Integrated Workplace Management System
4 1 (0.18%) Maximo
4 1 (0.18%) NetSuite
4 1 (0.18%) Odoo
Cloud Services
1 76 (14.05%) Azure
2 58 (10.72%) Cloud Computing
3 39 (7.21%) AWS
4 32 (5.91%) SaaS
5 30 (5.55%) Power Platform
6 21 (3.88%) Azure AI
7 13 (2.40%) GCP
8 12 (2.22%) Microsoft 365
9 11 (2.03%) Dynamics 365
9 11 (2.03%) PowerApps
10 10 (1.85%) Power Automate
11 8 (1.48%) Amazon S3
12 7 (1.29%) Amazon EKS
12 7 (1.29%) Azure DevOps
12 7 (1.29%) Microsoft Copilot
13 6 (1.11%) Amazon ELB
13 6 (1.11%) Azure Logic Apps
13 6 (1.11%) Serverless
14 5 (0.92%) Entra ID
15 4 (0.74%) Azure Data Factory
Communications & Networking
1 58 (10.72%) Internet
2 5 (0.92%) Intranet
3 1 (0.18%) Bluetooth
3 1 (0.18%) PuTTY
3 1 (0.18%) UWB
3 1 (0.18%) Wideband
3 1 (0.18%) Wireless
Database & Business Intelligence
1 24 (4.44%) Power BI
2 16 (2.96%) Tableau
3 14 (2.59%) SQL Server
4 9 (1.66%) Delta Lake
5 8 (1.48%) Metadata
6 7 (1.29%) Data Warehouse
6 7 (1.29%) DynamoDB
6 7 (1.29%) Spark SQL
7 5 (0.92%) NoSQL
8 4 (0.74%) MongoDB
9 3 (0.55%) Big Data
9 3 (0.55%) MySQL
9 3 (0.55%) PostgreSQL
9 3 (0.55%) Relational Database
10 2 (0.37%) Azure SQL Database
10 2 (0.37%) BigQuery
10 2 (0.37%) Neo4j
10 2 (0.37%) Power Query
10 2 (0.37%) Snowflake Schema
11 1 (0.18%) Metadata Repository
Development Applications
1 10 (1.85%) Git
2 6 (1.11%) MLflow
3 2 (0.37%) Jenkins
4 1 (0.18%) Babel
4 1 (0.18%) Cypress.io
4 1 (0.18%) GitLab
4 1 (0.18%) JIRA
4 1 (0.18%) JUnit
4 1 (0.18%) Mockito
4 1 (0.18%) Vite
4 1 (0.18%) webpack
General
1 127 (23.48%) Social Skills
2 116 (21.44%) Analytical Skills
3 88 (16.27%) Inclusion and Diversity
4 64 (11.83%) Banking
5 32 (5.91%) Retail
6 30 (5.55%) Finance
7 28 (5.18%) Public Sector
8 18 (3.33%) Law
8 18 (3.33%) Legal
9 17 (3.14%) Marketing
10 6 (1.11%) Agriculture
10 6 (1.11%) Financial Institution
10 6 (1.11%) Presentation Skills
11 5 (0.92%) Influencing Skills
11 5 (0.92%) Manufacturing
11 5 (0.92%) Organisational Skills
12 3 (0.55%) Automotive
13 2 (0.37%) Advertising
13 2 (0.37%) Back Office
14 1 (0.18%) Games
Job Titles
1 279 (51.57%) Trainer
2 48 (8.87%) Lecturer
3 46 (8.50%) Research Scientist
4 39 (7.21%) Architect
5 35 (6.47%) Content Editor
6 29 (5.36%) Developer
7 16 (2.96%) Biostatistician
8 13 (2.40%) Analyst
8 13 (2.40%) Junior
9 12 (2.22%) Customer Support Specialist
9 12 (2.22%) Solutions Architect
9 12 (2.22%) Support Specialist
10 11 (2.03%) Data Analyst
10 11 (2.03%) Junior Analyst
10 11 (2.03%) Junior Data Analyst
11 10 (1.85%) Data Engineer
12 9 (1.66%) Coordinator
13 8 (1.48%) Customer Service Representative
13 8 (1.48%) Lead
13 8 (1.48%) Software Engineer
Libraries, Frameworks & Software Standards
1 11 (2.03%) .NET
2 10 (1.85%) PySpark
3 8 (1.48%) RESTful
4 7 (1.29%) HTML
4 7 (1.29%) PyTorch
4 7 (1.29%) TensorFlow
5 6 (1.11%) .NET Framework
5 6 (1.11%) CSS
5 6 (1.11%) Keras
5 6 (1.11%) Lambda Expressions
5 6 (1.11%) Metaflow
5 6 (1.11%) NumPy
5 6 (1.11%) Pandas
5 6 (1.11%) React
5 6 (1.11%) scikit-learn
5 6 (1.11%) YAML
6 5 (0.92%) Spring
7 4 (0.74%) Entity Framework
7 4 (0.74%) REST
7 4 (0.74%) Spring Boot
Miscellaneous
1 60 (11.09%) IoT
2 46 (8.50%) Molecular Biology
3 12 (2.22%) Cloud Native
4 10 (1.85%) Data Centre
4 10 (1.85%) Self-Motivation
5 9 (1.66%) AI Agents
5 9 (1.66%) Onboarding
6 8 (1.48%) Linux Command Line
6 8 (1.48%) Web Conferencing
7 6 (1.11%) Blog
7 6 (1.11%) Microsoft Licensing
7 6 (1.11%) Product Ownership
8 5 (0.92%) e-Learning
8 5 (0.92%) Legacy Code
8 5 (0.92%) Legacy Systems
9 4 (0.74%) Algorithms
10 3 (0.55%) Data Structures
10 3 (0.55%) Greenfield Project
10 3 (0.55%) Learning Management System
10 3 (0.55%) Management Information System
Operating Systems
1 8 (1.48%) Windows
2 7 (1.29%) Unix
3 4 (0.74%) Linux
4 3 (0.55%) Windows Server
5 2 (0.37%) Mac OS X
6 1 (0.18%) OpenVMS
6 1 (0.18%) Red Hat Enterprise Linux
Processes & Methodologies
1 288 (53.23%) Conversational UI
2 106 (19.59%) Machine Learning
3 94 (17.38%) Chemistry
4 82 (15.16%) User Experience
5 76 (14.05%) Cybersecurity
6 62 (11.46%) Web Development
7 46 (8.50%) Biochemistry
7 46 (8.50%) Biology
7 46 (8.50%) Biotechnology
7 46 (8.50%) Data Interpretation
7 46 (8.50%) Experimental Design
8 43 (7.95%) Analytics
8 43 (7.95%) Customer Service
8 43 (7.95%) Roadmaps
9 42 (7.76%) Content Writing
10 38 (7.02%) Agile
11 33 (6.10%) Mathematics
12 30 (5.55%) Problem-Solving
13 28 (5.18%) CRM
14 27 (4.99%) Time Management
Programming Languages
1 67 (12.38%) Python
2 59 (10.91%) SQL
3 15 (2.77%) Java
3 15 (2.77%) JavaScript
4 10 (1.85%) C#
5 8 (1.48%) R
6 6 (1.11%) TypeScript
7 5 (0.92%) PowerShell
8 4 (0.74%) Bicep
9 3 (0.55%) PHP
10 2 (0.37%) Ruby
10 2 (0.37%) VB
11 1 (0.18%) Bash
11 1 (0.18%) C++
11 1 (0.18%) Data Analysis Expressions
11 1 (0.18%) PL/SQL
11 1 (0.18%) PROC SQL
Qualifications
1 363 (67.10%) Degree
2 229 (42.33%) Master's Degree
2 229 (42.33%) PhD
3 58 (10.72%) Postgraduate
4 13 (2.40%) Azure Certification
5 12 (2.22%) Security Cleared
6 11 (2.03%) SC Cleared
7 4 (0.74%) BPSS Clearance
7 4 (0.74%) TOGAF Certification
8 2 (0.37%) DBS Check
9 1 (0.18%) AWS Certification
9 1 (0.18%) Computer Science Degree
9 1 (0.18%) DV Cleared
9 1 (0.18%) Microsoft Certification
9 1 (0.18%) Six Sigma Green Belt
Quality Assurance & Compliance
1 6 (1.11%) QA
2 5 (0.92%) Accessibility
2 5 (0.92%) Data Quality
3 3 (0.55%) WCAG
4 1 (0.18%) Actionable Recommendations
4 1 (0.18%) COBIT
4 1 (0.18%) GDPR
System Software
1 12 (2.22%) Docker
2 1 (0.18%) Active Directory
2 1 (0.18%) Apache Flume
2 1 (0.18%) HDFS
Systems Management
1 15 (2.77%) Kubernetes
2 12 (2.22%) Terraform
3 6 (1.11%) Kubeflow
4 1 (0.18%) Ansible
4 1 (0.18%) Argo
4 1 (0.18%) Grafana
4 1 (0.18%) Kibana
4 1 (0.18%) Kustomize
4 1 (0.18%) logstash
4 1 (0.18%) Oozie
Vendors
1 279 (51.57%) PayPal
2 65 (12.01%) Microsoft
3 20 (3.70%) Databricks
4 16 (2.96%) Adobe
5 9 (1.66%) Apple
5 9 (1.66%) Palo Alto
6 6 (1.11%) OpenAI
6 6 (1.11%) UiPath
7 5 (0.92%) HubSpot
7 5 (0.92%) SAP
8 4 (0.74%) Cisco
8 4 (0.74%) Extreme Networks
8 4 (0.74%) Juniper
8 4 (0.74%) Salesforce
9 3 (0.55%) Google
10 2 (0.37%) Automation Anywhere
11 1 (0.18%) Denodo
11 1 (0.18%) Informatica
11 1 (0.18%) MicroStrategy
11 1 (0.18%) Planon