
1st/2nd Line Service Desk Analyst Job Trends
1st/2nd Line Service Desk Analyst
UK
The median 1st/2nd Line Service Desk Analyst salary in the UK is £31,762 per year, according to job vacancies posted during the 6 months leading to 1 November 2026.
The table below compares current salary benchmarking and summary statistics with the previous two years.
| 6 months to 1 Nov 2026 |
Same period 2025 | Same period 2024 | |
|---|---|---|---|
| Rank | 812 | 674 | 728 |
| Rank change year-on-year | -138 | +54 | -18 |
| Permanent 1st/2nd Line Service Desk Analyst jobs | 3 | 2 | 15 |
| As % of all permanent jobs in the UK | 0.002% | 0.004% | 0.022% |
| As % of the Job Titles category | 0.003% | 0.004% | 0.023% |
| Number of salaries quoted | 3 | 2 | 12 |
| 10th Percentile | - | £27,075 | £25,825 |
| 25th Percentile | £31,543 | £28,313 | £26,500 |
| Median annual salary (50th Percentile) | £31,762 | £31,250 | £35,000 |
| Median % change year-on-year | +1.64% | -10.71% | +7.69% |
| 75th Percentile | £33,490 | £33,813 | £36,500 |
| 90th Percentile | £34,396 | £34,825 | £44,150 |
| UK excluding London median annual salary | £31,762 | £27,500 | £35,000 |
| % change year-on-year | +15.50% | -21.43% | +27.27% |
All Permanent IT Job Roles
UK
For comparison with the information above, the following table provides summary statistics for all permanent IT job adverts matching a recognised job title. The table also shows what proportion of all permanent IT job adverts they make up.
| 6 months to 1 Nov 2026 |
Same period 2025 | Same period 2024 | |
|---|---|---|---|
| Permanent job adverts in the UK matching a recognised job title | 112,557 | 45,468 | 64,622 |
| % of permanent job adverts matching a recognised job title | 91.92% | 90.21% | 95.06% |
| Number of salaries quoted | 75,153 | 27,366 | 36,680 |
| 10th Percentile | £30,750 | £28,250 | £31,250 |
| 25th Percentile | £41,250 | £35,000 | £42,000 |
| Median annual salary (50th Percentile) | £59,000 | £52,500 | £57,000 |
| Median % change year-on-year | +12.38% | -7.89% | -5.00% |
| 75th Percentile | £76,250 | £73,750 | £75,000 |
| 90th Percentile | £97,500 | £92,500 | £95,000 |
| UK excluding London median annual salary | £55,000 | £46,000 | £50,000 |
| % change year-on-year | +19.57% | -8.00% | -4.76% |
1st/2nd Line Service Desk Analyst Job Vacancy Trend
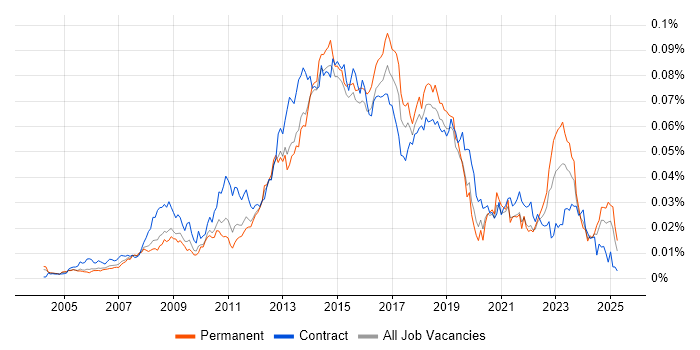
Historical trend showing the proportion of permanent 1st/2nd Line Service Desk Analyst job postings relative to all permanent IT jobs advertised.
1st/2nd Line Service Desk Analyst Salary Trend
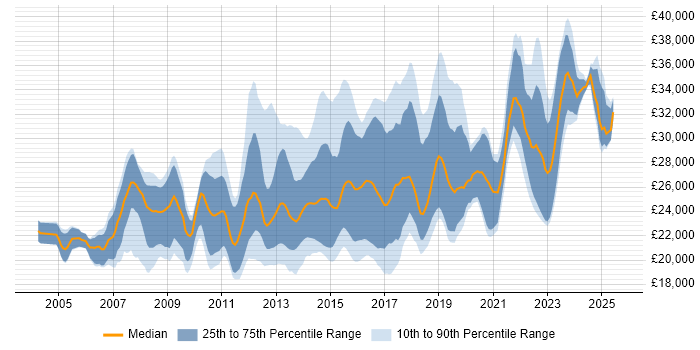
Salary distribution trend for 1st/2nd Line Service Desk Analyst job vacancies in the UK.
1st/2nd Line Service Desk Analyst Top 6 Job Locations
The table below looks at the demand and provides a guide to the median salaries quoted in 1st/2nd Line Service Desk Analyst jobs within the UK over the 6 months to 1 November 2026. The 'Rank Change' column provides an indication of the change in demand within each location based on the same 6 month period last year.
| Location | Rank Change on Same Period Last Year |
Job Ads Past 6 Months |
Median Salary Past 6 Months |
Median Salary % Change on Same Period Last Year |
Live Jobs |
|---|---|---|---|---|---|
| England | -138 | 3 | £31,762 | +1.64% | 1 |
| UK excluding London | -153 | 2 | £31,762 | +15.50% | 1 |
| North of England | - | 2 | £31,762 | - | |
| North West | - | 2 | £31,762 | - | |
| London | -71 | 1 | £35,000 | - | |
| Work from Home | - | 1 | £35,000 | - |
1st/2nd Line Service Desk Analyst Skill Set Top 17 Co-Occurring Skills & Capabilities
For the 6 months to 1 November 2026, 1st/2nd Line Service Desk Analyst job ads cited the following skills and capabilities in order of popularity. The figures indicate the absolute number of co-occurrences and as a proportion of all permanent 1st/2nd Line Service Desk Analyst job ads.
| Rank | Skill | Share | Job Ads |
|---|---|---|---|
| 1 | ITSM | 100.0% | 3 |
| 1 | Microsoft | 100.0% | 3 |
| 1 | Problem-Solving | 100.0% | 3 |
| 4 | DBS Check | 66.7% | 2 |
| 4 | Mathematics | 66.7% | 2 |
| 4 | Service Management | 66.7% | 2 |
| 7 | Active Directory | 33.3% | 1 |
| 7 | Azure | 33.3% | 1 |
| 7 | Customer Service | 33.3% | 1 |
| 7 | Entra ID | 33.3% | 1 |
| 7 | Investment Management | 33.3% | 1 |
| 7 | ITIL | 33.3% | 1 |
| 7 | ITIL Certification | 33.3% | 1 |
| 7 | Microsoft 365 | 33.3% | 1 |
| 7 | Wealth Management | 33.3% | 1 |
| 7 | Windows | 33.3% | 1 |
| 7 | Windows 10 | 33.3% | 1 |
1st/2nd Line Service Desk Analyst Skill Set Co-Occurring Skills & Capabilities by Category
The table below expands on the one above by listing co-occurrences one category at a time. It covers the same employment type, locality and period, with up to 20 co-occurrences in each category.
Job Titles
| Rank | Job Title | Share | Job Ads |
|---|---|---|---|
| 1 | IT Analyst | 100.0% | 3 |
| 2 | 1st/2nd Line Support Analyst | 66.7% | 2 |
| 2 | IT Support Analyst | 66.7% | 2 |
| 2 | Service Desk Support Analyst | 66.7% | 2 |