Problem Management Jobs

Problem Management
UK

The table below provides summary statistics for permanent job vacancies requiring Problem Management skills. It includes a benchmarking guide to the annual salaries offered in vacancies that cited Problem Management over the 6 months leading up to 31 May 2025, comparing them to the same period in the previous two years.

6 months to
31 May 2025
Same period 2024 Same period 2023
Rank 373 381 341
Rank change year-on-year +8 -40 +92
Permanent jobs citing Problem Management 368 706 937
As % of all permanent jobs advertised in the UK 0.66% 0.68% 0.98%
As % of the Processes & Methodologies category 0.70% 0.81% 1.02%
Number of salaries quoted 209 482 649
10th Percentile £33,750 £31,275 £31,350
25th Percentile £39,000 £40,400 £37,875
Median annual salary (50th Percentile) £51,447 £52,500 £50,000
Median % change year-on-year -2.01% +5.00% -
75th Percentile £63,750 £67,500 £67,070
90th Percentile £70,000 £87,500 £77,500
UK excluding London median annual salary £45,000 £48,500 £45,000
% change year-on-year -7.22% +7.78% -

All Process and Methodology Skills
UK

Problem Management falls under the Processes and Methodologies category. For comparison with the information above, the following table provides summary statistics for all permanent job vacancies requiring process or methodology skills.

Permanent vacancies with a requirement for process or methodology skills 52,256 87,133 91,481
As % of all permanent jobs advertised in the UK 93.58% 84.04% 95.51%
Number of salaries quoted 25,854 60,896 54,581
10th Percentile £28,822 £29,250 £34,000
25th Percentile £41,250 £40,000 £45,000
Median annual salary (50th Percentile) £57,000 £55,000 £60,899
Median % change year-on-year +3.64% -9.69% +1.50%
75th Percentile £75,000 £72,500 £81,250
90th Percentile £97,500 £92,500 £100,000
UK excluding London median annual salary £51,564 £50,000 £55,000
% change year-on-year +3.13% -9.09% +4.76%

Problem Management
Job Vacancy Trend

Job postings citing Problem Management as a proportion of all IT jobs advertised.
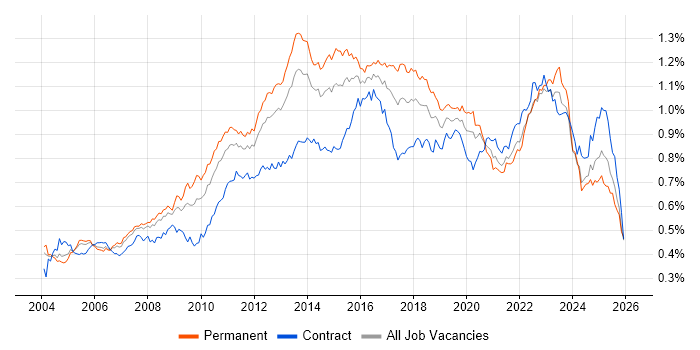
Job vacancy trend for Problem Management in the UK

Problem Management
Salary Trend

3-month moving average salary quoted in jobs citing Problem Management.

Salary trend for Problem Management in the UK

Problem Management
Salary Histogram

Salary distribution for jobs citing Problem Management over the 6 months to 31 May 2025.

Salary histogram for Problem Management in the UK

Problem Management
Top 17 Job Locations

The table below looks at the demand and provides a guide to the median salaries quoted in IT jobs citing Problem Management within the UK over the 6 months to 31 May 2025. The 'Rank Change' column provides an indication of the change in demand within each location based on the same 6 month period last year.

Location Rank Change
on Same Period
Last Year
Matching
Permanent
IT Job Ads
Median Salary
Past 6 Months
Median Salary
% Change
on Same Period
Last Year
Live
Jobs
England -3 351 £51,500 -1.90% 239
Work from Home +22 203 £51,500 -6.36% 99
UK excluding London -21 200 £45,000 -7.22% 181
London +46 127 £62,500 -19.35% 87
South East +9 65 £47,250 -2.58% 54
Midlands +15 47 £43,750 -12.50% 31
West Midlands +30 38 £42,500 -21.30% 24
North of England -55 37 £45,000 -13.46% 41
North West -39 24 £50,000 -13.04% 19
East of England +45 22 £45,250 +0.56% 20
South West +79 17 £47,500 +11.76% 9
Yorkshire +28 12 £42,000 -26.96% 21
East Midlands +19 9 £49,000 +1.03% 7
Wales +30 8 £38,094 -24.94% 5
Scotland +106 4 £57,500 +27.78% 14
Northern Ireland +41 2 £50,000 - 9
North East +26 1 £28,500 -33.60% 1

Problem Management
Co-occurring Skills and Capabilities by Category

The follow tables expand on the table above by listing co-occurrences grouped by category. The same employment type, locality and period is covered with up to 20 co-occurrences shown in each of the following categories:

Application Platforms
1 23 (6.25%) Microsoft Exchange
2 20 (5.43%) SharePoint
3 12 (3.26%) IIS
4 4 (1.09%) Skype for Business
5 3 (0.82%) Blackberry Enterprise Server
5 3 (0.82%) Exchange Server 2013
6 1 (0.27%) Apache Spark
6 1 (0.27%) Appian
6 1 (0.27%) Confluence
Applications
1 45 (12.23%) Microsoft Office
2 11 (2.99%) Chatbot
3 6 (1.63%) Microsoft Excel
4 4 (1.09%) Microsoft PowerPoint
5 1 (0.27%) Spreadsheet
Business Applications
1 8 (2.17%) Remedy ITSM
2 6 (1.63%) SAP S/4HANA
3 5 (1.36%) Dynamics AX
4 2 (0.54%) Carpe Diem
4 2 (0.54%) Elite 3E
4 2 (0.54%) Infor CloudSuite
4 2 (0.54%) Infor CloudSuite Industrial (formerly SyteLine)
5 1 (0.27%) Exchequer
5 1 (0.27%) Shopify
5 1 (0.27%) Unit4 Business World
Cloud Services
1 126 (34.24%) Azure
2 82 (22.28%) Microsoft 365
3 48 (13.04%) AWS
4 29 (7.88%) Azure Monitor
5 28 (7.61%) Entra ID
6 27 (7.34%) SaaS
7 23 (6.25%) Power Platform
8 18 (4.89%) GCP
9 14 (3.80%) PaaS
10 12 (3.26%) Azure Data Factory
10 12 (3.26%) IaaS
11 11 (2.99%) Dynamics 365
12 10 (2.72%) Azure DevOps
13 8 (2.17%) Datadog
13 8 (2.17%) OneDrive
14 7 (1.90%) Azure Logic Apps
14 7 (1.90%) Microsoft Purview
15 6 (1.63%) Azure Sentinel
15 6 (1.63%) Power Automate
15 6 (1.63%) PowerApps
Communications & Networking
1 79 (21.47%) Broadband
2 28 (7.61%) WAN
3 23 (6.25%) LAN
4 21 (5.71%) Firewall
4 21 (5.71%) Wireless
5 19 (5.16%) DNS
5 19 (5.16%) VPN
6 15 (4.08%) Wi-Fi
7 10 (2.72%) DHCP
7 10 (2.72%) WLAN
8 9 (2.45%) VLAN
9 8 (2.17%) SD-WAN
10 5 (1.36%) HTTPS
10 5 (1.36%) Network Security
10 5 (1.36%) TCP/IP
11 4 (1.09%) SAN
11 4 (1.09%) Skype
11 4 (1.09%) VoIP
12 3 (0.82%) Internet
12 3 (0.82%) SMTP
Database & Business Intelligence
1 29 (7.88%) SQL Server
2 12 (3.26%) SQL Server Integration Services
3 11 (2.99%) DB2
4 8 (2.17%) Power BI
4 8 (2.17%) Relational Database
5 7 (1.90%) SQL Server Reporting Services
6 3 (0.82%) Metadata
6 3 (0.82%) Metadata Repository
6 3 (0.82%) Spark SQL
7 2 (0.54%) Apache Cassandra
7 2 (0.54%) GIS
7 2 (0.54%) MongoDB
7 2 (0.54%) PostgreSQL
8 1 (0.27%) Apache Hive
8 1 (0.27%) Crystal Reports
8 1 (0.27%) DTS
8 1 (0.27%) EDRMS
8 1 (0.27%) MySQL
8 1 (0.27%) Oracle Reports
8 1 (0.27%) RDBMS
Development Applications
1 10 (2.72%) JIRA
2 7 (1.90%) Visual Studio
3 5 (1.36%) Git
3 5 (1.36%) Jenkins
4 4 (1.09%) Cypress.io
5 2 (0.54%) GitLab
General
1 234 (63.59%) Social Skills
2 81 (22.01%) Games
3 77 (20.92%) Finance
4 44 (11.96%) Law
5 39 (10.60%) Analytical Skills
6 30 (8.15%) Legal
7 15 (4.08%) Banking
8 13 (3.53%) Inclusion and Diversity
9 9 (2.45%) Financial Institution
10 8 (2.17%) Public Sector
10 8 (2.17%) Welsh Language
11 7 (1.90%) Documentation Skills
12 6 (1.63%) Retail
13 5 (1.36%) Advertising
14 4 (1.09%) Influencing Skills
14 4 (1.09%) Organisational Skills
15 3 (0.82%) Telecoms
16 2 (0.54%) Investment Banking
17 1 (0.27%) Front Office
17 1 (0.27%) Manufacturing
Job Titles
1 122 (33.15%) Senior
2 95 (25.82%) Senior Manager
3 86 (23.37%) Analyst
4 82 (22.28%) Senior Service Manager
5 79 (21.47%) Engineering Manager
5 79 (21.47%) ServiceNow Manager
6 45 (12.23%) Support Analyst
7 35 (9.51%) Lead
8 29 (7.88%) Applications Support
9 27 (7.34%) Support Engineer
10 24 (6.52%) Applications Support Analyst
11 21 (5.71%) Service Manager
12 20 (5.43%) Infrastructure Engineer
13 18 (4.89%) IT Support
13 18 (4.89%) Senior Analyst
14 15 (4.08%) Service Desk Manager
15 14 (3.80%) Cloud Engineer
16 12 (3.26%) 3rd Line Engineer
16 12 (3.26%) Service Analyst
17 11 (2.99%) 2nd Line Support
Libraries, Frameworks & Software Standards
1 31 (8.42%) .NET
2 13 (3.53%) Hugging Face
2 13 (3.53%) LangChain
2 13 (3.53%) PyTorch
2 13 (3.53%) TensorFlow
3 10 (2.72%) .NET Framework
4 7 (1.90%) ASP.NET
5 6 (1.63%) HTML
5 6 (1.63%) Node.js
5 6 (1.63%) React
6 5 (1.36%) CSS
6 5 (1.36%) EDI
7 4 (1.09%) Jest
7 4 (1.09%) RESTful
7 4 (1.09%) Vue
8 3 (0.82%) PySpark
8 3 (0.82%) Spring
8 3 (0.82%) Spring Boot
9 2 (0.54%) Middleware
9 2 (0.54%) XML
Miscellaneous
1 107 (29.08%) Management Information System
2 81 (22.01%) Product Ownership
3 79 (21.47%) Video\Live Streaming
4 11 (2.99%) Linux Command Line
5 9 (2.45%) Client/Server
5 9 (2.45%) IoT
5 9 (2.45%) Private Cloud
6 7 (1.90%) Analytical Mindset
6 7 (1.90%) Cloud Native
6 7 (1.90%) Data Centre
6 7 (1.90%) Driving Licence
7 6 (1.63%) Hedge funds
8 5 (1.36%) Distributed Architecture
9 4 (1.09%) CCTV
9 4 (1.09%) Low-Code
9 4 (1.09%) Onboarding
9 4 (1.09%) Public Cloud
10 3 (0.82%) Data Protection Act
10 3 (0.82%) iPad
10 3 (0.82%) iPhone
Operating Systems
1 92 (25.00%) Windows
2 41 (11.14%) Windows Server
3 32 (8.70%) Linux
4 28 (7.61%) Mac OS
4 28 (7.61%) Windows 10
5 17 (4.62%) Apple iOS
6 5 (1.36%) AIX
6 5 (1.36%) Unix
6 5 (1.36%) Windows Server 2016
7 4 (1.09%) Red Hat Enterprise Linux
8 3 (0.82%) Windows Server 2019
9 1 (0.27%) zOS
Processes & Methodologies
1 191 (51.90%) Incident Management
2 190 (51.63%) Change Management
3 174 (47.28%) ITIL
4 167 (45.38%) Service Delivery
5 130 (35.33%) ITSM
6 105 (28.53%) Computer Science
7 100 (27.17%) Roadmaps
8 95 (25.82%) Service Management
9 88 (23.91%) Problem-Solving
10 81 (22.01%) Software Engineering
10 81 (22.01%) Validation
11 80 (21.74%) Deployment Automation
12 79 (21.47%) Software Delivery
13 62 (16.85%) Root Cause Analysis
14 56 (15.22%) Customer Service
15 40 (10.87%) Continuous Improvement
16 31 (8.42%) Artificial Intelligence
16 31 (8.42%) Asset Management
17 29 (7.88%) Mentoring
18 28 (7.61%) CI/CD
Programming Languages
1 43 (11.68%) SQL
2 18 (4.89%) PowerShell
2 18 (4.89%) Python
3 16 (4.35%) Shell Script
4 15 (4.08%) Bash
5 11 (2.99%) C#
5 11 (2.99%) Java
6 10 (2.72%) JavaScript
7 9 (2.45%) PL/SQL
8 7 (1.90%) T-SQL
8 7 (1.90%) VB.NET
9 6 (1.63%) TypeScript
10 2 (0.54%) Gremlin
10 2 (0.54%) Kusto Query Language
10 2 (0.54%) Perl
11 1 (0.27%) ActionScript
11 1 (0.27%) ActionScript 2.0
11 1 (0.27%) Bicep
11 1 (0.27%) JCL
11 1 (0.27%) REXX
Qualifications
1 115 (31.25%) Degree
2 98 (26.63%) Computer Science Degree
3 26 (7.07%) ITIL Certification
3 26 (7.07%) Security Cleared
4 24 (6.52%) SC Cleared
5 19 (5.16%) Azure Certification
5 19 (5.16%) Master's Degree
6 16 (4.35%) Microsoft Certification
7 12 (3.26%) DBS Check
8 11 (2.99%) Cisco Certification
9 10 (2.72%) AWS Certification
9 10 (2.72%) ITIL Foundation Certificate
9 10 (2.72%) MCSA
10 9 (2.45%) CISSP
11 8 (2.17%) CISM
11 8 (2.17%) MCSE
12 7 (1.90%) A+ Certification
12 7 (1.90%) CISA
13 6 (1.63%) GIAC
13 6 (1.63%) ISACA
Quality Assurance & Compliance
1 54 (14.67%) SLA
2 9 (2.45%) ISO/IEC 27001
3 7 (1.90%) GDPR
4 5 (1.36%) Accessibility
4 5 (1.36%) GRC
4 5 (1.36%) JSP 440
4 5 (1.36%) NCSC
4 5 (1.36%) QA
5 4 (1.09%) Sarbanes-Oxley
6 2 (0.54%) COBIT
7 1 (0.27%) Data Quality
System Software
1 65 (17.66%) Active Directory
2 13 (3.53%) Docker
3 11 (2.99%) Firmware
3 11 (2.99%) VMware Infrastructure
4 10 (2.72%) BitLocker
5 9 (2.45%) Virtual Desktop
6 8 (2.17%) Virtual Machines
7 2 (0.54%) Hyper-V
8 1 (0.27%) NFS
8 1 (0.27%) Time Sharing Option
8 1 (0.27%) Virtual Servers
8 1 (0.27%) VMware ESXi
8 1 (0.27%) vSphere
8 1 (0.27%) Xen
Systems Management
1 51 (13.86%) Microsoft Intune
2 25 (6.79%) Grafana
3 24 (6.52%) Prometheus
4 20 (5.43%) SCCM
5 13 (3.53%) Kubernetes
6 9 (2.45%) Terraform
7 8 (2.17%) Ansible
8 2 (0.54%) Control-M
8 2 (0.54%) ITRS Geneos
8 2 (0.54%) Nessus
8 2 (0.54%) NetBackup
8 2 (0.54%) Progress Chef
8 2 (0.54%) Puppet
8 2 (0.54%) SCOM
9 1 (0.27%) DatAdvantage
9 1 (0.27%) Failover Clustering
9 1 (0.27%) FortiGate
9 1 (0.27%) Kibana
9 1 (0.27%) Single Sign-On
9 1 (0.27%) Tivoli Storage Manager
Vendors
1 142 (38.59%) Microsoft
2 104 (28.26%) ServiceNow
3 37 (10.05%) Apple
4 27 (7.34%) Cisco
5 21 (5.71%) VMware
6 19 (5.16%) Oracle
7 16 (4.35%) HP
7 16 (4.35%) Meraki
8 13 (3.53%) OpenAI
8 13 (3.53%) SolarWinds
9 11 (2.99%) SAP
10 10 (2.72%) MobileIron
11 9 (2.45%) Citrix
12 8 (2.17%) Remedy
12 8 (2.17%) Splunk
13 7 (1.90%) McAfee
14 6 (1.63%) Dell
14 6 (1.63%) Dynatrace
15 5 (1.36%) NetApp
16 4 (1.09%) Red Hat