Microsoft Office Jobs

Microsoft Office
UK

The table below provides summary statistics for permanent job vacancies requiring Microsoft Office skills. It includes a benchmarking guide to the annual salaries offered in vacancies that cited Microsoft Office over the 6 months leading up to 23 October 2024, comparing them to the same period in the previous two years.

6 months to
23 Oct 2024
Same period 2023 Same period 2022
Rank 36 75 83
Rank change year-on-year +39 +8 +13
Permanent jobs citing Microsoft Office 3,884 2,394 5,195
As % of all permanent jobs advertised in the UK 5.13% 4.03% 3.70%
As % of the Applications category 56.68% 50.87% 40.33%
Number of salaries quoted 1,076 1,740 3,025
10th Percentile £26,250 £24,363 £24,188
25th Percentile £31,250 £28,500 £28,500
Median annual salary (50th Percentile) £42,500 £38,000 £38,500
Median % change year-on-year +11.84% -1.30% +2.67%
75th Percentile £58,750 £57,588 £54,500
90th Percentile £75,000 £68,750 £67,500
UK excluding London median annual salary £40,748 £35,000 £35,000
% change year-on-year +16.42% - +7.69%

All Software Application Skills
UK

Microsoft Office falls under the Software Applications category. For comparison with the information above, the following table provides summary statistics for all permanent job vacancies requiring software application skills.

Permanent vacancies with a requirement for software application skills 6,853 4,706 12,882
As % of all permanent jobs advertised in the UK 9.06% 7.92% 9.17%
Number of salaries quoted 2,407 3,312 6,723
10th Percentile £28,000 £25,000 £26,250
25th Percentile £35,200 £31,248 £32,000
Median annual salary (50th Percentile) £48,000 £45,000 £45,000
Median % change year-on-year +6.67% - +4.65%
75th Percentile £62,500 £61,250 £61,250
90th Percentile £80,000 £73,975 £78,750
UK excluding London median annual salary £45,000 £38,875 £39,700
% change year-on-year +15.76% -2.08% +5.87%

Microsoft Office
Job Vacancy Trend

Job postings citing Microsoft Office as a proportion of all IT jobs advertised.
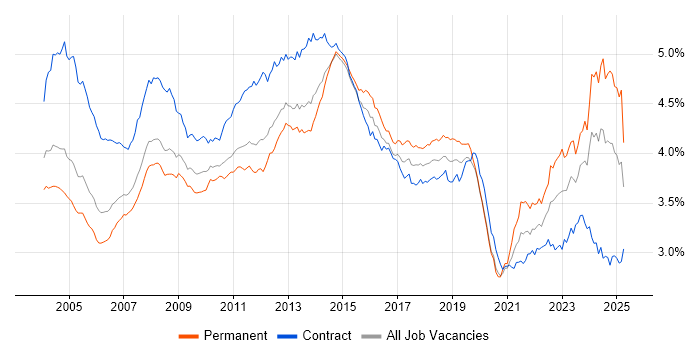
Job vacancy trend for Microsoft Office in the UK

Microsoft Office
Salary Trend

3-month moving average salary quoted in jobs citing Microsoft Office.

Salary trend for Microsoft Office in the UK

Microsoft Office
Salary Histogram

Salary distribution for jobs citing Microsoft Office over the 6 months to 23 October 2024.

Salary histogram for Microsoft Office in the UK

Microsoft Office
Top 19 Job Locations

The table below looks at the demand and provides a guide to the median salaries quoted in IT jobs citing Microsoft Office within the UK over the 6 months to 23 October 2024. The 'Rank Change' column provides an indication of the change in demand within each location based on the same 6 month period last year.

Location Rank Change
on Same Period
Last Year
Matching
Permanent
IT Job Ads
Median Salary
Past 6 Months
Median Salary
% Change
on Same Period
Last Year
Live
Jobs
England +37 3,659 £42,500 +13.33% 1,000
UK excluding London +38 3,193 £40,748 +16.42% 845
North of England +64 1,154 £42,500 +30.77% 205
Midlands +40 865 £35,000 +3.70% 151
Yorkshire +57 623 £34,500 +6.15% 62
Work from Home -9 605 £40,000 -20.00% 1,465
London -19 604 £50,000 +5.26% 220
South East +10 596 £42,500 +13.33% 227
West Midlands +42 545 £35,000 -7.89% 93
North West +49 467 £47,683 +49.01% 125
East Midlands +27 320 £31,750 +19.81% 57
South West +26 276 £33,500 -16.25% 103
East of England -43 130 £32,000 +6.67% 116
Scotland +7 120 £58,033 +54.75% 45
North East +9 64 £35,000 +7.69% 25
Wales +12 32 £38,750 +33.62% 16
Northern Ireland +29 17 £52,500 +72.13% 17
Channel Islands -6 3 £60,000 +33.33%
Isle of Man -7 3 - -

Microsoft Office
Co-occurring Skills and Capabilities by Category

The follow tables expand on the table above by listing co-occurrences grouped by category. The same employment type, locality and period is covered with up to 20 co-occurrences shown in each of the following categories:

Application Platforms
1 280 (7.21%) SharePoint
2 187 (4.81%) Microsoft Exchange
3 30 (0.77%) Confluence
4 25 (0.64%) SAS
5 18 (0.46%) ArcGIS
6 13 (0.33%) Skype for Business
7 11 (0.28%) CMS
8 10 (0.26%) IIS
9 5 (0.13%) IBM Domino
10 4 (0.10%) Office Communications Server
10 4 (0.10%) WordPress
11 2 (0.051%) Apache
11 2 (0.051%) Apache Airflow
11 2 (0.051%) Apache Spark
11 2 (0.051%) IBM Notes
Applications
1 1,627 (41.89%) Microsoft Excel
2 459 (11.82%) Microsoft PowerPoint
3 82 (2.11%) MS Visio
4 66 (1.70%) Microsoft Project
5 26 (0.67%) Photoshop
6 23 (0.59%) Spreadsheet
7 16 (0.41%) Acrobat
8 14 (0.36%) AutoCAD
9 9 (0.23%) Adobe Premiere
9 9 (0.23%) Fireworks
9 9 (0.23%) RoboHelp
10 8 (0.21%) Adobe Creative Suite
10 8 (0.21%) InDesign
11 5 (0.13%) Adobe Illustrator
12 4 (0.10%) Adobe After Effects
12 4 (0.10%) Adobe Captivate
13 3 (0.077%) Final Cut Pro
13 3 (0.077%) OrCAD
13 3 (0.077%) Trello
14 2 (0.051%) NUKE
Business Applications
1 140 (3.60%) Teamcenter
2 30 (0.77%) iTrent
3 26 (0.67%) OpenText VIM for SAP
4 25 (0.64%) NEC Housing
5 21 (0.54%) Dynamics CRM
5 21 (0.54%) Maximo
6 16 (0.41%) Dynamics NAV
7 11 (0.28%) ResourceLink
8 7 (0.18%) SAP S/4HANA
8 7 (0.18%) Visualfiles
9 6 (0.15%) Magento
10 5 (0.13%) NetSuite
11 4 (0.10%) Changepoint
11 4 (0.10%) Infor CloudSuite Industrial (formerly SyteLine)
11 4 (0.10%) Primavera
11 4 (0.10%) SAP Business One
12 3 (0.077%) Elite 3E
12 3 (0.077%) Raiser’s Edge
12 3 (0.077%) Sage 200
13 2 (0.051%) Relativity
Cloud Services
1 585 (15.06%) Microsoft 365
2 278 (7.16%) Azure
3 136 (3.50%) Power Platform
4 91 (2.34%) Entra ID
5 55 (1.42%) Google Workspace
6 54 (1.39%) AWS
7 50 (1.29%) OneDrive
8 43 (1.11%) SuccessFactors
9 34 (0.88%) Azure DevOps
9 34 (0.88%) PowerApps
10 31 (0.80%) PaaS
11 30 (0.77%) Dynamics 365
12 29 (0.75%) IaaS
13 26 (0.67%) Mimecast
13 26 (0.67%) SaaS
14 19 (0.49%) Power Automate
15 16 (0.41%) Cloud Computing
16 15 (0.39%) GCP
16 15 (0.39%) Snowflake
17 12 (0.31%) Azure Synapse Analytics
Communications & Networking
1 195 (5.02%) Firewall
2 148 (3.81%) DNS
3 131 (3.37%) DHCP
4 112 (2.88%) TCP/IP
5 104 (2.68%) VPN
6 76 (1.96%) LAN
7 66 (1.70%) WAN
8 53 (1.36%) Broadband
9 48 (1.24%) Internet
10 47 (1.21%) SAN
11 39 (1.00%) Wi-Fi
12 35 (0.90%) Wireless
13 33 (0.85%) WLAN
14 32 (0.82%) VLAN
15 30 (0.77%) Remote Desktop
16 26 (0.67%) VoIP
17 23 (0.59%) BGP
17 23 (0.59%) OSPF
18 22 (0.57%) 4G
19 20 (0.51%) 5G
Database & Business Intelligence
1 89 (2.29%) Power BI
2 79 (2.03%) SQL Server
3 43 (1.11%) Tableau
4 26 (0.67%) Relational Database
5 18 (0.46%) Data Warehouse
5 18 (0.46%) SQL Server Reporting Services
6 16 (0.41%) SQL Server Integration Services
7 12 (0.31%) Amazon RDS
7 12 (0.31%) MySQL
8 10 (0.26%) Metadata
9 8 (0.21%) Big Data
10 7 (0.18%) Data Lake
10 7 (0.18%) DB2
11 6 (0.15%) Data Mining
12 5 (0.13%) GIS
13 4 (0.10%) EDRMS
13 4 (0.10%) MS Access
14 3 (0.077%) RDBMS
14 3 (0.077%) SQL Server Analysis Services
15 2 (0.051%) QlikView
Development Applications
1 102 (2.63%) JIRA
2 25 (0.64%) Visual Studio
3 19 (0.49%) Selenium
4 10 (0.26%) MSI
4 10 (0.26%) Visual Studio Code
5 9 (0.23%) AdminStudio
5 9 (0.23%) InstallShield
5 9 (0.23%) Jenkins
5 9 (0.23%) NUnit
5 9 (0.23%) SpecFlow
6 6 (0.15%) Git
7 5 (0.13%) eggPlant
7 5 (0.13%) LabVIEW
7 5 (0.13%) Postman
8 4 (0.10%) Bugzilla
9 3 (0.077%) SQL Server Management Studio (SSMS)
10 2 (0.051%) GitLab
10 2 (0.051%) Katalon Studio
10 2 (0.051%) MLflow
10 2 (0.051%) Tricentis qTest
General
1 2,132 (54.89%) Social Skills
2 988 (25.44%) Marketing
3 970 (24.97%) Finance
4 735 (18.92%) Analytical Skills
5 684 (17.61%) Retail
6 358 (9.22%) Legal
7 356 (9.17%) Organisational Skills
8 313 (8.06%) French Language
9 291 (7.49%) Military
10 271 (6.98%) German Language
11 149 (3.84%) Automotive
12 138 (3.55%) Aerospace
13 119 (3.06%) Law
14 118 (3.04%) Manufacturing
15 117 (3.01%) Presentation Skills
16 113 (2.91%) Inclusion and Diversity
17 110 (2.83%) Telecoms
18 61 (1.57%) Banking
19 59 (1.52%) Public Sector
20 51 (1.31%) Electronics
Job Titles
1 591 (15.22%) Analyst
2 573 (14.75%) Consultant
3 530 (13.65%) Technical Consultant
4 521 (13.41%) Solutions Consultant
5 453 (11.66%) Development Manager
6 350 (9.01%) Graduate
7 311 (8.01%) Senior
8 226 (5.82%) IT Support
9 171 (4.40%) Coordinator
10 163 (4.20%) Business Manager
11 162 (4.17%) Project Manager
12 155 (3.99%) Business Development Manager
13 152 (3.91%) IT Analyst
14 147 (3.78%) Support Analyst
15 138 (3.55%) Service Analyst
16 124 (3.19%) Administrator
16 124 (3.19%) Lead
17 116 (2.99%) Service Desk Analyst
18 102 (2.63%) Engineering Manager
18 102 (2.63%) Senior Manager
Libraries, Frameworks & Software Standards
1 37 (0.95%) HTML
2 28 (0.72%) .NET
3 27 (0.70%) XML
4 19 (0.49%) Web Services
5 13 (0.33%) ADO
5 13 (0.33%) CSS
6 12 (0.31%) JSON
6 12 (0.31%) Node.js
7 10 (0.26%) Flash
8 8 (0.21%) Oracle Fusion
8 8 (0.21%) REST
9 7 (0.18%) ASP.NET
10 6 (0.15%) .NET Framework
10 6 (0.15%) Spring
11 5 (0.13%) Middleware
11 5 (0.13%) NumPy
11 5 (0.13%) Pandas
12 4 (0.10%) HTML5 Canvas
12 4 (0.10%) pytest
12 4 (0.10%) React
Miscellaneous
1 305 (7.85%) Self-Motivation
2 291 (7.49%) Onboarding
3 155 (3.99%) Management Information System
4 129 (3.32%) Driving Licence
5 81 (2.09%) Social Media
6 59 (1.52%) Video Conferencing
7 35 (0.90%) Credit Risk
8 34 (0.88%) e-Learning
8 34 (0.88%) Replication
9 32 (0.82%) Smartphone
10 29 (0.75%) Life Science
11 26 (0.67%) Foreign Exchange (FX)
12 21 (0.54%) Learning Management System
13 18 (0.46%) Data Centre
13 18 (0.46%) iPhone
14 17 (0.44%) EPoS
15 16 (0.41%) Enterprise Software
16 14 (0.36%) Analytical Mindset
17 11 (0.28%) CCTV
17 11 (0.28%) CMDB
Operating Systems
1 716 (18.43%) Windows
2 300 (7.72%) Windows 10
3 194 (4.99%) Windows Server
4 81 (2.09%) Apple iOS
5 71 (1.83%) Android
6 62 (1.60%) Linux
7 57 (1.47%) Windows Server 2019
8 56 (1.44%) Windows Server 2016
9 42 (1.08%) Windows 7
10 35 (0.90%) Mac OS
11 28 (0.72%) Mac OS X
12 26 (0.67%) Windows Server 2012
13 21 (0.54%) Ubuntu
13 21 (0.54%) Windows Vista
14 18 (0.46%) Unix
15 14 (0.36%) Windows Server 2008
16 9 (0.23%) Windows 8
17 5 (0.13%) VMS
18 3 (0.077%) VxWorks
19 2 (0.051%) Windows XP
Processes & Methodologies
1 1,104 (28.42%) Problem-Solving
2 908 (23.38%) Logistics
3 834 (21.47%) Customer Service
4 637 (16.40%) Continuous Improvement
5 576 (14.83%) Agile
6 541 (13.93%) Business Development
7 413 (10.63%) Data Analysis
8 409 (10.53%) Project Management
9 392 (10.09%) Customer Experience
10 391 (10.07%) Customer Requirements
11 384 (9.89%) Process Improvement
12 383 (9.86%) Data Management
13 377 (9.71%) CAD
14 365 (9.40%) Facilities Management
15 362 (9.32%) Performance Metrics
16 360 (9.27%) Commercial Awareness
17 358 (9.22%) Financial Modelling
18 355 (9.14%) Creative Thinking
19 327 (8.42%) Contingency Planning
20 309 (7.96%) ITIL
Programming Languages
1 197 (5.07%) SQL
2 120 (3.09%) MATLAB
3 105 (2.70%) PowerShell
4 68 (1.75%) Python
5 52 (1.34%) C#
6 47 (1.21%) VBA
7 32 (0.82%) JavaScript
8 26 (0.67%) T-SQL
9 24 (0.62%) C++
10 20 (0.51%) Java
11 15 (0.39%) C
12 12 (0.31%) VB
13 11 (0.28%) Shell Script
14 10 (0.26%) R
15 9 (0.23%) RPG
15 9 (0.23%) RPG IV
16 7 (0.18%) VB.NET
17 6 (0.15%) VBScript
18 4 (0.10%) Apex Code
19 2 (0.051%) Scala
Qualifications
1 1,686 (43.41%) Degree
2 176 (4.53%) HND
3 154 (3.96%) HNC
4 125 (3.22%) Security Cleared
5 101 (2.60%) SC Cleared
6 88 (2.27%) Microsoft Certification
7 83 (2.14%) DBS Check
8 47 (1.21%) Computer Science Degree
8 47 (1.21%) Master's Degree
9 43 (1.11%) CIPD
10 40 (1.03%) MCSE
11 37 (0.95%) A+ Certification
11 37 (0.95%) CIMA
12 32 (0.82%) PMI Certification
13 30 (0.77%) PMP
14 29 (0.75%) ACCA
14 29 (0.75%) MCP
15 27 (0.70%) ITIL Certification
16 23 (0.59%) BPSS Clearance
16 23 (0.59%) ITIL Foundation Certificate
Quality Assurance & Compliance
1 109 (2.81%) QA
2 85 (2.19%) SLA
3 60 (1.54%) GDPR
4 46 (1.18%) PMO
5 44 (1.13%) Accessibility
6 43 (1.11%) ISO/IEC 27001
7 41 (1.06%) Data Quality
8 36 (0.93%) Cyber Essentials
9 20 (0.51%) ISO 9001
10 17 (0.44%) NIST
11 11 (0.28%) Cyber Essentials PLUS
12 6 (0.15%) COBIT
12 6 (0.15%) ISO/IEC 20000
12 6 (0.15%) NIST 800
13 4 (0.10%) IFRS
13 4 (0.10%) ISO 14001
13 4 (0.10%) ISO/IEC 17025
13 4 (0.10%) NEBOSH
14 3 (0.077%) ISO 13485
14 3 (0.077%) ISO/IEC 27005
System Software
1 479 (12.33%) Active Directory
2 114 (2.94%) VMware Infrastructure
3 78 (2.01%) Hyper-V
4 27 (0.70%) Firmware
5 14 (0.36%) Virtual Servers
6 12 (0.31%) XenApp
7 11 (0.28%) XenDesktop
8 10 (0.26%) Microsoft App-V
9 9 (0.23%) Virtual Desktop
10 8 (0.21%) Microsoft Virtual Server
10 8 (0.21%) Virtual Machines
11 4 (0.10%) vSphere
12 3 (0.077%) Docker
12 3 (0.077%) IAG
12 3 (0.077%) Terminal Services
12 3 (0.077%) VirtualBox
13 2 (0.051%) Embedded Firmware
13 2 (0.051%) Terminal Server
13 2 (0.051%) VMware ESXi
13 2 (0.051%) VMware Workstation
Systems Management
1 100 (2.57%) Microsoft Intune
2 97 (2.50%) SCCM
3 29 (0.75%) WSUS
4 15 (0.39%) Backup Exec
5 14 (0.36%) Single Sign-On
6 13 (0.33%) Jamf Pro
7 11 (0.28%) Symantec Endpoint Protection
8 9 (0.23%) HP ALM
8 9 (0.23%) Systems Management Server (SMS)
9 7 (0.18%) AirWatch
9 7 (0.18%) Ansible
9 7 (0.18%) Terraform
10 6 (0.15%) McAfee ePO
11 4 (0.10%) CASB
11 4 (0.10%) FortiGate
12 3 (0.077%) Symantec Enterprise Vault
13 2 (0.051%) DatAdvantage
13 2 (0.051%) Grafana
13 2 (0.051%) Kubernetes
13 2 (0.051%) SmoothWall
Vendors
1 2,484 (63.95%) Microsoft
2 179 (4.61%) SAP
3 142 (3.66%) VMware
4 115 (2.96%) ANSYS
5 86 (2.21%) Cisco
6 80 (2.06%) Apple
7 78 (2.01%) Citrix
8 77 (1.98%) Google
9 66 (1.70%) Salesforce
10 61 (1.57%) ServiceNow
11 47 (1.21%) Adobe
12 40 (1.03%) Dell
13 39 (1.00%) iManage
14 36 (0.93%) Fortinet
15 33 (0.85%) Oracle
15 33 (0.85%) Remedy
16 32 (0.82%) OpenText
17 29 (0.75%) NEC
18 26 (0.67%) Ariba
18 26 (0.67%) HP