Project Management
UK

The following table provides summary statistics for permanent job vacancies with a requirement for Project Management skills. Included is a benchmarking guide to the salaries offered in vacancies that have cited Project Management over the 6 months to 10 December 2023 with a comparison to the same period in the previous 2 years.

6 months to
10 Dec 2023
Same period 2022 Same period 2021
Rank 26 26 37
Rank change year-on-year 0 +11 +13
Permanent jobs citing Project Management 4,107 10,600 9,428
As % of all permanent jobs advertised in the UK 7.86% 8.67% 7.42%
As % of the Processes & Methodologies category 8.35% 9.06% 7.77%
Number of salaries quoted 2,708 5,855 6,019
10th Percentile £37,500 £37,500 £36,250
25th Percentile £46,250 £46,250 £43,750
Median annual salary (50th Percentile) £60,000 £58,500 £55,000
Median % change year-on-year +2.56% +6.36% -
75th Percentile £72,500 £75,000 £71,250
90th Percentile £87,575 £90,000 £85,000
UK excluding London median annual salary £55,000 £52,500 £50,000
% change year-on-year +4.76% +5.00% +1.80%

All Process and Methodology Skills
UK

Project Management is in the Processes and Methodologies category. The following table is for comparison with the above and provides summary statistics for all permanent job vacancies with a requirement for process or methodology skills.

Permanent vacancies with a requirement for process or methodology skills 49,175 117,045 121,323
As % of all permanent jobs advertised in the UK 94.07% 95.76% 95.47%
Number of salaries quoted 35,535 71,782 82,169
10th Percentile £32,250 £34,575 £32,500
25th Percentile £43,750 £45,000 £42,500
Median annual salary (50th Percentile) £60,000 £61,000 £60,000
Median % change year-on-year -1.64% +1.67% +9.09%
75th Percentile £80,000 £82,500 £77,500
90th Percentile £98,750 £100,000 £95,000
UK excluding London median annual salary £52,500 £53,519 £50,000
% change year-on-year -1.90% +7.04% +4.17%

Project Management
Job Vacancy Trend

Job postings citing Project Management as a proportion of all IT jobs advertised.
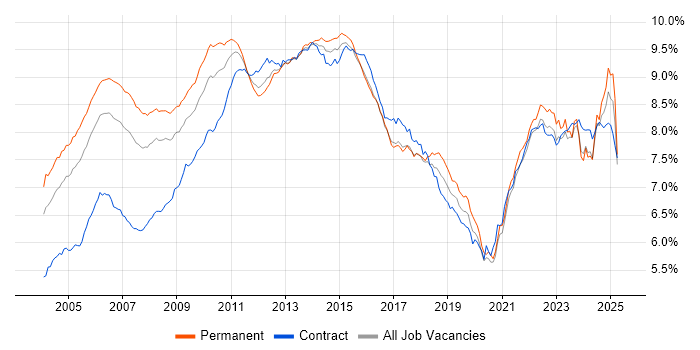
Job vacancy trend for Project Management in the UK

Project Management
Salary Trend

3-month moving average salary quoted in jobs citing Project Management.

Salary trend for Project Management in the UK

Project Management
Salary Histogram

Salary distribution for jobs citing Project Management over the 6 months to 10 December 2023.

Salary histogram for Project Management in the UK

Project Management
Top 18 Job Locations

The table below looks at the demand and provides a guide to the median salaries quoted in IT jobs citing Project Management within the UK over the 6 months to 10 December 2023. The 'Rank Change' column provides an indication of the change in demand within each location based on the same 6 month period last year.

Location Rank Change
on Same Period
Last Year
Matching
Permanent
IT Job Ads
Median Salary
Past 6 Months
Median Salary
% Change
on Same Period
Last Year
Live
Jobs
England +1 3,573 £60,000 - 2,992
UK excluding London -4 2,515 £55,000 +4.76% 2,019
Work from Home +2 1,750 £58,000 +0.87% 1,429
London +4 1,302 £67,500 - 1,126
South East -7 652 £55,000 - 537
North of England +1 566 £55,000 +4.76% 482
Midlands -4 440 £55,000 +4.76% 356
South West -1 370 £53,500 +6.89% 245
West Midlands -5 316 £55,000 +4.76% 259
North West -4 280 £56,000 +2.28% 229
Yorkshire +2 245 £57,500 +11.65% 193
Scotland -8 192 £55,000 - 143
East of England +1 152 £57,500 +6.48% 255
East Midlands -1 122 £54,000 +2.86% 95
Wales -8 110 £48,523 -2.95% 60
North East 0 41 £51,250 +4.59% 67
Northern Ireland +13 38 £57,500 +27.78% 24
Isle of Man 0 1 £72,500 -

Project Management
Co-occurring Skills and Capabilities by Category

The follow tables expand on the table above by listing co-occurrences grouped by category. The same employment type, locality and period is covered with up to 20 co-occurrences shown in each of the following categories:

Application Platforms
1 128 (3.12%) SharePoint
2 89 (2.17%) Confluence
3 62 (1.51%) SAS
4 49 (1.19%) CMS
5 32 (0.78%) MS Exchange
6 22 (0.54%) Apache Spark
7 10 (0.24%) WordPress
8 8 (0.19%) IIS
9 6 (0.15%) Adobe Experience Manager
9 6 (0.15%) Mendix
9 6 (0.15%) nginx
10 5 (0.12%) Apache
10 5 (0.12%) Exchange Server 2010
10 5 (0.12%) Headless CMS
11 4 (0.097%) OpenStack
12 3 (0.073%) Exchange Server 2003
12 3 (0.073%) Skype for Business
13 2 (0.049%) Alfresco
13 2 (0.049%) Captiva
13 2 (0.049%) Drupal
Applications
1 265 (6.45%) Microsoft Office
2 188 (4.58%) Microsoft Excel
3 178 (4.33%) Microsoft Project
4 103 (2.51%) Microsoft PowerPoint
5 55 (1.34%) MS Visio
6 28 (0.68%) AutoCAD
7 17 (0.41%) Trello
8 8 (0.19%) Spreadsheet
9 6 (0.15%) Simulink
9 6 (0.15%) SOLIDWORKS
10 5 (0.12%) Autodesk Inventor
10 5 (0.12%) OrCAD
11 4 (0.097%) LibreOffice
11 4 (0.097%) Oracle Smart View
12 3 (0.073%) Adobe Creative Suite
13 2 (0.049%) Blender
13 2 (0.049%) EViews
13 2 (0.049%) MicroStation
13 2 (0.049%) SketchUp
13 2 (0.049%) TargetLink
Business Applications
1 58 (1.41%) SAP S/4HANA
2 32 (0.78%) Primavera
3 31 (0.75%) Dynamics CRM
4 21 (0.51%) Remedy ITSM
4 21 (0.51%) SAP ERP
5 19 (0.46%) Unit4 Business World
6 18 (0.44%) Elite 3E
7 16 (0.39%) SAP CO
7 16 (0.39%) SAP FI
7 16 (0.39%) SAP FI/CO
8 13 (0.32%) Maximo
9 12 (0.29%) SAP MM
10 10 (0.24%) Shopify
11 9 (0.22%) Dynamics NAV
11 9 (0.22%) Infor M3
11 9 (0.22%) ProductWriter
11 9 (0.22%) Sparx Enterprise Architect
12 8 (0.19%) HFM
12 8 (0.19%) Salesforce CRM
13 7 (0.17%) Sage X3
Cloud Services
1 566 (13.78%) Azure
2 334 (8.13%) Microsoft 365
3 238 (5.79%) Power Platform
4 220 (5.36%) SaaS
5 186 (4.53%) AWS
6 102 (2.48%) PaaS
7 99 (2.41%) Azure DevOps
8 94 (2.29%) IaaS
9 72 (1.75%) GCP
10 65 (1.58%) Dynamics 365
11 55 (1.34%) Entra ID
12 52 (1.27%) PowerApps
13 41 (1.00%) Power Automate
14 39 (0.95%) Cloud Computing
15 24 (0.58%) Google Analytics
15 24 (0.58%) OCI
16 23 (0.56%) WhatsApp
17 21 (0.51%) Azure Logic Apps
17 21 (0.51%) Smartsheet
18 15 (0.37%) Serverless
Communications & Networking
1 123 (2.99%) Firewall
2 105 (2.56%) SAN
3 99 (2.41%) WAN
4 85 (2.07%) VPN
5 71 (1.73%) LAN
6 57 (1.39%) DNS
7 47 (1.14%) Intranet
8 44 (1.07%) DHCP
9 41 (1.00%) Wi-Fi
10 39 (0.95%) Wireless
11 35 (0.85%) SD-WAN
12 34 (0.83%) Network Security
13 30 (0.73%) TCP/IP
13 30 (0.73%) VLAN
14 28 (0.68%) Internet
15 24 (0.58%) WLAN
16 23 (0.56%) Unified Communications
16 23 (0.56%) VoIP
17 19 (0.46%) 5G
17 19 (0.46%) MPLS
Database & Business Intelligence
1 174 (4.24%) Power BI
2 147 (3.58%) SQL Server
3 64 (1.56%) Data Warehouse
4 56 (1.36%) Tableau
5 46 (1.12%) Base SAS
6 45 (1.10%) Relational Database
7 42 (1.02%) Metadata
8 40 (0.97%) MySQL
9 32 (0.78%) Data Mining
10 30 (0.73%) SQL Server Reporting Services
11 27 (0.66%) Hadoop
11 27 (0.66%) SQL Server Integration Services
12 26 (0.63%) Data Lake
13 23 (0.56%) Elasticsearch
13 23 (0.56%) NoSQL
14 22 (0.54%) GIS
15 20 (0.49%) Apache Ignite
15 20 (0.49%) PostgreSQL
16 19 (0.46%) Big Data
17 12 (0.29%) Data Hub
Development Applications
1 220 (5.36%) JIRA
2 60 (1.46%) Git
3 41 (1.00%) Team Foundation Server
4 34 (0.83%) Jenkins
5 21 (0.51%) Visual Studio
6 18 (0.44%) MSI
7 15 (0.37%) AdminStudio
7 15 (0.37%) InstallShield
7 15 (0.37%) Visual Studio Team System
8 12 (0.29%) Bitbucket
9 7 (0.17%) TestRail
10 6 (0.15%) LabVIEW
10 6 (0.15%) Oracle APEX
10 6 (0.15%) Subversion
11 4 (0.097%) GitLab
11 4 (0.097%) HP UFT
11 4 (0.097%) JUnit
11 4 (0.097%) Maven
11 4 (0.097%) Postman
11 4 (0.097%) SQL Server Management Studio (SSMS)
General
1 1,589 (38.69%) Social Skills
2 1,179 (28.71%) Finance
3 628 (15.29%) Analytical Skills
4 292 (7.11%) Organisational Skills
5 287 (6.99%) Public Sector
6 281 (6.84%) Manufacturing
7 277 (6.74%) Retail
8 276 (6.72%) Presentation Skills
9 267 (6.50%) Inclusion and Diversity
10 261 (6.36%) Marketing
11 207 (5.04%) Legal
12 131 (3.19%) Banking
13 120 (2.92%) Telecoms
14 107 (2.61%) Law
15 98 (2.39%) Influencing Skills
16 91 (2.22%) Pharmaceutical
17 80 (1.95%) Aerospace
18 74 (1.80%) Electronics
19 63 (1.53%) Automotive
20 52 (1.27%) Local Government
Job Titles
1 1,346 (32.77%) Project Manager
2 550 (13.39%) Senior
3 457 (11.13%) Analyst
4 363 (8.84%) IT Manager
5 272 (6.62%) Senior Manager
6 250 (6.09%) Lead
7 248 (6.04%) IT Project Manager
8 239 (5.82%) Architect
9 234 (5.70%) Senior Project Manager
10 201 (4.89%) Consultant
11 177 (4.31%) Developer
12 169 (4.11%) Business Analyst
13 121 (2.95%) Infrastructure Manager
14 101 (2.46%) Technical Manager
15 93 (2.26%) Delivery Manager
16 92 (2.24%) Infrastructure Architect
16 92 (2.24%) Solutions Architect
17 88 (2.14%) Infrastructure Project Manager
18 82 (2.00%) Software Engineer
19 72 (1.75%) Junior
Libraries, Frameworks & Software Standards
1 127 (3.09%) .NET
2 82 (2.00%) XML
3 78 (1.90%) React
4 61 (1.49%) REST
5 59 (1.44%) AngularJS
6 56 (1.36%) HTML
6 56 (1.36%) Web Services
7 47 (1.14%) JSON
8 46 (1.12%) CSS
9 39 (0.95%) SOAP
10 32 (0.78%) ASP.NET
11 30 (0.73%) React Native
12 29 (0.71%) .NET Framework
13 27 (0.66%) RESTful
14 26 (0.63%) Kafka
15 24 (0.58%) EDI
16 22 (0.54%) Velocity
17 20 (0.49%) Spring
17 20 (0.49%) Vue
18 18 (0.44%) jQuery
Miscellaneous
1 340 (8.28%) Management Information System
2 222 (5.41%) Virtual Team
3 165 (4.02%) Self-Motivation
4 151 (3.68%) Onboarding
5 130 (3.17%) Product Ownership
6 112 (2.73%) Public Cloud
7 84 (2.05%) Data Centre
8 67 (1.63%) Life Science
9 66 (1.61%) Driving Licence
9 66 (1.61%) Private Cloud
10 64 (1.56%) PMI
11 44 (1.07%) Social Media
12 39 (0.95%) FMCG
13 35 (0.85%) Enterprise Software
14 33 (0.80%) NHS
15 32 (0.78%) Data Structures
15 32 (0.78%) Legacy Systems
16 27 (0.66%) Analytical Mindset
17 25 (0.61%) Data Protection Act
18 24 (0.58%) Greenfield Project
Operating Systems
1 360 (8.77%) Windows
2 160 (3.90%) Linux
3 88 (2.14%) Windows Server
4 59 (1.44%) Windows 10
5 28 (0.68%) Unix
6 25 (0.61%) Android
7 23 (0.56%) Windows Server 2012
7 23 (0.56%) Windows Server 2016
8 21 (0.51%) Apple iOS
9 19 (0.46%) Windows 7
10 13 (0.32%) Windows Server 2019
11 10 (0.24%) Mac OS
12 7 (0.17%) VMS
12 7 (0.17%) Windows Server 2008
13 5 (0.12%) Windows XP
14 3 (0.073%) Windows 2000 Server
15 2 (0.049%) Embedded Linux
15 2 (0.049%) Windows Server 2003
15 2 (0.049%) Windows Vista
16 1 (0.024%) Ubuntu
Processes & Methodologies
1 1,579 (38.45%) Agile
2 1,133 (27.59%) Project Delivery
3 915 (22.28%) Problem-Solving
4 716 (17.43%) PRINCE2
5 684 (16.65%) Stakeholder Management
6 494 (12.03%) Change Management
7 460 (11.20%) Waterfall
8 444 (10.81%) SDLC
9 441 (10.74%) ITIL
10 439 (10.69%) Actionable Insight
11 424 (10.32%) Scrum
12 411 (10.01%) Mentoring
13 394 (9.59%) Computer Science
14 359 (8.74%) Continuous Improvement
15 328 (7.99%) Decision-Making
16 325 (7.91%) ERP
17 304 (7.40%) Service Management
18 303 (7.38%) Migration
19 300 (7.30%) Roadmaps
20 283 (6.89%) Business Analysis
Programming Languages
1 305 (7.43%) SQL
2 196 (4.77%) Python
3 154 (3.75%) JavaScript
4 127 (3.09%) C#
5 126 (3.07%) Java
6 92 (2.24%) PowerShell
7 46 (1.12%) SAS Macro
8 34 (0.83%) C++
9 33 (0.80%) R
10 29 (0.71%) Perl
11 28 (0.68%) TypeScript
12 27 (0.66%) Bash
13 25 (0.61%) C
14 23 (0.56%) T-SQL
15 20 (0.49%) MATLAB
15 20 (0.49%) VB
16 18 (0.44%) PHP
17 11 (0.27%) Data Analysis Expressions
18 8 (0.19%) VBA
18 8 (0.19%) X++
Qualifications
1 1,134 (27.61%) Degree
2 421 (10.25%) Security Cleared
3 254 (6.18%) SC Cleared
4 234 (5.70%) Computer Science Degree
5 189 (4.60%) PMI Certification
6 177 (4.31%) PMP
7 112 (2.73%) DV Cleared
8 98 (2.39%) Master's Degree
9 73 (1.78%) DBS Check
10 68 (1.66%) PRINCE2 Practitioner
11 65 (1.58%) PRINCE2 Certification
12 58 (1.41%) BPSS Clearance
13 41 (1.00%) Cisco Certification
14 38 (0.93%) Microsoft Certification
15 33 (0.80%) Numerate Degree
16 28 (0.68%) CCNA
16 28 (0.68%) ITIL Certification
17 26 (0.63%) Azure Certification
18 24 (0.58%) APMP
18 24 (0.58%) CISSP
Quality Assurance & Compliance
1 327 (7.96%) QA
2 325 (7.91%) PMO
3 46 (1.12%) CDISC
3 46 (1.12%) Data Quality
3 46 (1.12%) ISO/IEC 27001
4 43 (1.05%) GDPR
5 41 (1.00%) SLA
6 33 (0.80%) Accessibility
7 23 (0.56%) NIST
8 19 (0.46%) Sarbanes-Oxley
9 18 (0.44%) ISO 9001
10 15 (0.37%) GRC
11 14 (0.34%) Cyber Essentials
12 11 (0.27%) COBIT
12 11 (0.27%) GMP
12 11 (0.27%) ITGC
13 10 (0.24%) Actionable Recommendations
13 10 (0.24%) GxP
14 8 (0.19%) IFRS
15 7 (0.17%) MISRA
System Software
1 180 (4.38%) Active Directory
2 86 (2.09%) VMware Infrastructure
3 32 (0.78%) Hyper-V
4 26 (0.63%) Docker
5 24 (0.58%) Firmware
6 23 (0.56%) VMware ESXi
7 17 (0.41%) Virtual Machines
8 16 (0.39%) Microsoft App-V
9 10 (0.24%) Embedded Firmware
9 10 (0.24%) Terminal Server
10 6 (0.15%) Virtual Servers
11 5 (0.12%) BitLocker
11 5 (0.12%) Virtual Desktop
12 3 (0.073%) Ceph
12 3 (0.073%) KVM
12 3 (0.073%) Microsoft Virtual Server
12 3 (0.073%) vSphere
13 2 (0.049%) Citrix Hypervisor
13 2 (0.049%) VMware Server
13 2 (0.049%) XenDesktop
Systems Management
1 88 (2.14%) Terraform
2 81 (1.97%) Ansible
3 76 (1.85%) SCCM
4 65 (1.58%) Microsoft Intune
5 27 (0.66%) Kubernetes
6 24 (0.58%) WSUS
7 10 (0.24%) SCOM
7 10 (0.24%) Single Sign-On
8 9 (0.22%) NetBackup
9 7 (0.17%) FortiGate
9 7 (0.17%) Progress Chef
10 6 (0.15%) Puppet
11 5 (0.12%) Active Directory Federation Services
11 5 (0.12%) EMC NetWorker
11 5 (0.12%) Grafana
11 5 (0.12%) Packer
11 5 (0.12%) vCenter Server
12 3 (0.073%) Functional Safety
12 3 (0.073%) Nagios
13 2 (0.049%) Tivoli Storage Manager
Vendors
1 678 (16.51%) Microsoft
2 237 (5.77%) SAP
3 216 (5.26%) Oracle
4 197 (4.80%) Salesforce
5 146 (3.55%) NEC
6 130 (3.17%) ServiceNow
7 119 (2.90%) VMware
8 113 (2.75%) Google
9 85 (2.07%) Cisco
10 73 (1.78%) Dell
11 64 (1.56%) HP
12 45 (1.10%) Remedy
13 40 (0.97%) Citrix
14 32 (0.78%) Bloomberg
15 27 (0.66%) BMC
16 24 (0.58%) IBM
17 22 (0.54%) Sage
18 21 (0.51%) Atlassian
18 21 (0.51%) Palo Alto
18 21 (0.51%) Veeam