Incident Management
UK

The following table provides summary statistics for permanent job vacancies with a requirement for Incident Management skills. Included is a benchmarking guide to the salaries offered in vacancies that have cited Incident Management over the 6 months to 7 December 2023 with a comparison to the same period in the previous 2 years.

6 months to
7 Dec 2023
Same period 2022 Same period 2021
Rank 197 227 257
Rank change year-on-year +30 +30 -8
Permanent jobs citing Incident Management 943 1,995 1,818
As % of all permanent jobs advertised in the UK 1.78% 1.62% 1.42%
As % of the Processes & Methodologies category 1.89% 1.70% 1.49%
Number of salaries quoted 602 1,418 1,419
10th Percentile £29,269 £28,500 £24,000
25th Percentile £37,000 £36,000 £31,250
Median annual salary (50th Percentile) £50,000 £50,000 £47,500
Median % change year-on-year - +5.26% -
75th Percentile £65,000 £68,500 £65,000
90th Percentile £79,875 £84,056 £80,000
UK excluding London median annual salary £47,500 £47,500 £42,500
% change year-on-year - +11.76% -

All Process and Methodology Skills
UK

Incident Management is in the Processes and Methodologies category. The following table is for comparison with the above and provides summary statistics for all permanent job vacancies with a requirement for process or methodology skills.

Permanent vacancies with a requirement for process or methodology skills 49,863 117,613 122,319
As % of all permanent jobs advertised in the UK 94.11% 95.75% 95.45%
Number of salaries quoted 36,022 72,003 82,155
10th Percentile £32,500 £34,700 £32,500
25th Percentile £43,750 £45,000 £42,500
Median annual salary (50th Percentile) £60,000 £61,000 £60,000
Median % change year-on-year -1.64% +1.67% +9.09%
75th Percentile £80,000 £82,500 £77,500
90th Percentile £99,680 £100,000 £95,000
UK excluding London median annual salary £52,500 £53,500 £50,000
% change year-on-year -1.87% +7.00% +4.17%

Incident Management
Job Vacancy Trend

Job postings citing Incident Management as a proportion of all IT jobs advertised.
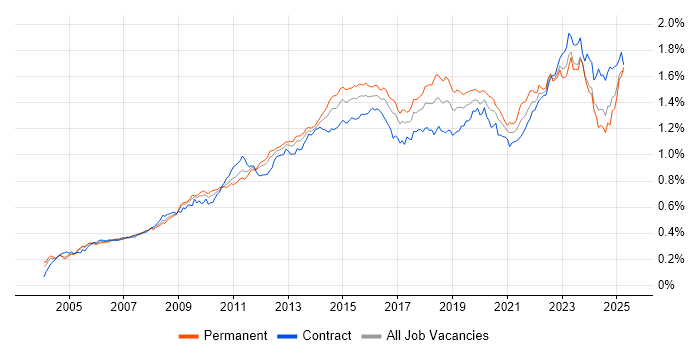
Job vacancy trend for Incident Management in the UK

Incident Management
Salary Trend

3-month moving average salary quoted in jobs citing Incident Management.

Salary trend for Incident Management in the UK

Incident Management
Salary Histogram

Salary distribution for jobs citing Incident Management over the 6 months to 7 December 2023.

Salary histogram for Incident Management in the UK

Incident Management
Top 17 Job Locations

The table below looks at the demand and provides a guide to the median salaries quoted in IT jobs citing Incident Management within the UK over the 6 months to 7 December 2023. The 'Rank Change' column provides an indication of the change in demand within each location based on the same 6 month period last year.

Location Rank Change
on Same Period
Last Year
Matching
Permanent
IT Job Ads
Median Salary
Past 6 Months
Median Salary
% Change
on Same Period
Last Year
Live
Jobs
England +14 786 £50,000 - 351
UK excluding London +32 693 £47,500 - 239
Work from Home +24 358 £55,000 +10.00% 246
London +41 216 £60,500 -3.20% 123
South East +64 209 £50,000 +11.11% 49
North of England -5 154 £45,000 -4.00% 70
Midlands +53 88 £40,250 -19.50% 51
South West +50 84 £49,000 +15.29% 34
North West +15 80 £45,000 -5.26% 33
Wales +62 73 £42,288 -18.97% 2
Yorkshire -2 63 £47,500 +5.56% 28
West Midlands +67 60 £42,288 -15.43% 35
Scotland +14 44 £52,500 +31.25% 14
East of England +8 29 £55,000 +22.22% 18
East Midlands +26 28 £39,625 -6.76% 16
Northern Ireland +46 13 £35,000 -9.75% 3
North East +38 11 £34,686 +15.62% 9

Incident Management
Co-occurring Skills and Capabilities by Category

The follow tables expand on the table above by listing co-occurrences grouped by category. The same employment type, locality and period is covered with up to 20 co-occurrences shown in each of the following categories:

Application Platforms
1 87 (9.23%) WebLogic
2 66 (7.00%) SharePoint
3 30 (3.18%) IIS
4 12 (1.27%) Confluence
5 11 (1.17%) MS Exchange
6 8 (0.85%) Oracle Service Bus
6 8 (0.85%) WebSphere
7 2 (0.21%) Exchange Server 2013
7 2 (0.21%) NetWeaver
7 2 (0.21%) nginx
8 1 (0.11%) SAS
8 1 (0.11%) SharePoint Server
Applications
1 70 (7.42%) Microsoft Office
2 26 (2.76%) Microsoft Excel
3 9 (0.95%) MS Visio
4 5 (0.53%) Microsoft PowerPoint
4 5 (0.53%) Microsoft Project
5 2 (0.21%) Spreadsheet
Business Applications
1 12 (1.27%) Remedy ITSM
2 8 (0.85%) Dynamics CRM
2 8 (0.85%) Dynamics NAV
3 6 (0.64%) iTrent
4 3 (0.32%) Dynamics GP
4 3 (0.32%) Elite 3E
5 2 (0.21%) Adaptiv
5 2 (0.21%) SAP S/4HANA
6 1 (0.11%) ION Anvil
6 1 (0.11%) NetSuite
6 1 (0.11%) PlanetPress Connect
6 1 (0.11%) SAP PP
6 1 (0.11%) SAP SCM
6 1 (0.11%) SAP WM
Cloud Services
1 176 (18.66%) Microsoft 365
2 163 (17.29%) Azure
3 48 (5.09%) AWS
4 33 (3.50%) Entra ID
5 23 (2.44%) Azure DevOps
5 23 (2.44%) SaaS
6 21 (2.23%) Power Platform
7 14 (1.48%) Azure Monitor
8 12 (1.27%) Dynamics 365
9 11 (1.17%) Azure Sentinel
9 11 (1.17%) OneDrive
9 11 (1.17%) PowerApps
10 10 (1.06%) GCP
11 8 (0.85%) Cloud Computing
11 8 (0.85%) GitHub
11 8 (0.85%) Yammer
12 7 (0.74%) IaaS
13 4 (0.42%) Amazon EC2
13 4 (0.42%) Mimecast
13 4 (0.42%) PaaS
Communications & Networking
1 116 (12.30%) LAN
2 112 (11.88%) Firewall
3 110 (11.66%) WAN
4 70 (7.42%) Intrusion Detection
5 47 (4.98%) VPN
6 42 (4.45%) DNS
7 34 (3.61%) SAN
8 32 (3.39%) DHCP
9 31 (3.29%) Wireless
10 24 (2.55%) Network Security
10 24 (2.55%) TCP/IP
11 21 (2.23%) Cisco Nexus
12 20 (2.12%) NAS
13 18 (1.91%) Cisco ASA
13 18 (1.91%) Wi-Fi
14 16 (1.70%) Cisco Firepower
14 16 (1.70%) Internet
15 14 (1.48%) Skype
16 12 (1.27%) BGP
17 11 (1.17%) Cisco IOS
Database & Business Intelligence
1 81 (8.59%) Elasticsearch
2 45 (4.77%) SQL Server
3 32 (3.39%) MySQL
4 30 (3.18%) Relational Database
5 29 (3.08%) RDBMS
6 11 (1.17%) PostgreSQL
7 9 (0.95%) Oracle Database
8 8 (0.85%) Oracle Database 10g
8 8 (0.85%) Oracle Database 11g
8 8 (0.85%) VLDB
9 7 (0.74%) DB2
10 4 (0.42%) Amazon RDS
10 4 (0.42%) BusinessObjects
11 3 (0.32%) Azure SQL Database
11 3 (0.32%) GIS
11 3 (0.32%) Power BI
12 2 (0.21%) Oracle Reports
12 2 (0.21%) SAP HANA
12 2 (0.21%) SQL Server Integration Services
13 1 (0.11%) Apache Hive
Development Applications
1 54 (5.73%) JIRA
2 24 (2.55%) GitLab
2 24 (2.55%) Sonatype Nexus
3 6 (0.64%) Git
4 4 (0.42%) Oracle Forms
5 1 (0.11%) Jenkins
5 1 (0.11%) Subversion
5 1 (0.11%) Team Foundation Server
5 1 (0.11%) TeamCity
5 1 (0.11%) Visual Studio
General
1 367 (38.92%) Social Skills
2 196 (20.78%) Analytical Skills
3 148 (15.69%) Finance
4 70 (7.42%) Retail
5 66 (7.00%) Inclusion and Diversity
6 61 (6.47%) Games
7 49 (5.20%) Organisational Skills
8 47 (4.98%) Banking
9 39 (4.14%) Legal
10 35 (3.71%) Public Sector
11 31 (3.29%) Military
12 30 (3.18%) Law
13 20 (2.12%) Local Government
13 20 (2.12%) Telecoms
14 14 (1.48%) Financial Institution
15 13 (1.38%) Police
16 12 (1.27%) Fire and Rescue
16 12 (1.27%) Manufacturing
17 9 (0.95%) Documentation Skills
18 8 (0.85%) Automotive
Job Titles
1 297 (31.50%) Analyst
2 211 (22.38%) Senior
3 134 (14.21%) Support Analyst
4 118 (12.51%) Applications Support
5 104 (11.03%) Applications Support Analyst
6 84 (8.91%) Security Manager
7 78 (8.27%) Senior Analyst
8 76 (8.06%) Support Engineer
9 69 (7.32%) Service Analyst
10 68 (7.21%) Lead
11 64 (6.79%) Senior Support Analyst
12 63 (6.68%) Senior Manager
13 62 (6.57%) Senior Applications Support
13 62 (6.57%) Senior Applications Support Analyst
14 61 (6.47%) Business Manager
15 60 (6.36%) Senior Business Manager
16 57 (6.04%) Service Manager
17 51 (5.41%) Security Analyst
18 50 (5.30%) IT Manager
18 50 (5.30%) IT Support
Libraries, Frameworks & Software Standards
1 79 (8.38%) J2EE
1 79 (8.38%) Java EE
1 79 (8.38%) Spring
2 31 (3.29%) .NET
3 11 (1.17%) Middleware
4 7 (0.74%) Elastic Stack
5 6 (0.64%) CSS
5 6 (0.64%) HTML
5 6 (0.64%) Oracle Fusion
6 5 (0.53%) Velocity
7 4 (0.42%) .NET Framework
7 4 (0.42%) React
7 4 (0.42%) web3js
8 3 (0.32%) .NET Core
8 3 (0.32%) AngularJS
8 3 (0.32%) ASP.NET
8 3 (0.32%) CSS3
8 3 (0.32%) EDI
8 3 (0.32%) XHTML
9 2 (0.21%) Web Services
Miscellaneous
1 111 (11.77%) Management Information System
2 74 (7.85%) Security Operations Centre
3 35 (3.71%) Data Centre
4 27 (2.86%) PKI
4 27 (2.86%) Self-Motivation
5 24 (2.55%) Onboarding
6 20 (2.12%) CMDB
7 19 (2.01%) Driving Licence
8 18 (1.91%) Clustering
9 17 (1.80%) iPhone
10 16 (1.70%) Fat Client
10 16 (1.70%) Thin Client
11 13 (1.38%) Cyber Threat
11 13 (1.38%) Distributed Denial-of-Service
11 13 (1.38%) Hedge funds
11 13 (1.38%) Mainframe
11 13 (1.38%) Robotics
11 13 (1.38%) Security Posture
12 11 (1.17%) Product Ownership
13 8 (0.85%) Greenfield Project
Operating Systems
1 358 (37.96%) Windows
2 203 (21.53%) Unix
3 129 (13.68%) Linux
4 115 (12.20%) Windows Server
5 67 (7.10%) Windows 10
6 48 (5.09%) Android
7 38 (4.03%) Windows Server 2016
8 34 (3.61%) Windows Server 2012
9 17 (1.80%) Red Hat Enterprise Linux
10 14 (1.48%) Solaris
11 13 (1.38%) Windows Server 2019
12 12 (1.27%) Windows 7
13 11 (1.17%) Mac OS
14 10 (1.06%) zOS
15 7 (0.74%) Debian
15 7 (0.74%) Ubuntu
16 4 (0.42%) VMS
16 4 (0.42%) Windows NT
16 4 (0.42%) Windows Server 2008
16 4 (0.42%) Windows XP
Processes & Methodologies
1 365 (38.71%) ITIL
2 263 (27.89%) Service Management
3 242 (25.66%) Problem-Solving
4 198 (21.00%) Problem Management
5 183 (19.41%) Customer Service
6 166 (17.60%) Change Management
7 155 (16.44%) Cybersecurity
7 155 (16.44%) Service Delivery
8 152 (16.12%) Impact Assessments
9 136 (14.42%) ITSM
10 118 (12.51%) Actionable Insight
11 112 (11.88%) Security Operations
12 107 (11.35%) SIEM
13 94 (9.97%) Vulnerability Management
14 91 (9.65%) Agile
15 88 (9.33%) Containerisation
16 85 (9.01%) Vulnerability Scanning
17 84 (8.91%) Stakeholder Management
18 83 (8.80%) Security Management
19 80 (8.48%) Information Management
Programming Languages
1 112 (11.88%) PowerShell
2 86 (9.12%) Java
3 67 (7.10%) SQL
4 59 (6.26%) Shell Script
5 34 (3.61%) C#
6 26 (2.76%) Python
7 10 (1.06%) Bash
8 9 (0.95%) PL/SQL
9 8 (0.85%) JavaScript
10 6 (0.64%) Perl
10 6 (0.64%) T-SQL
11 5 (0.53%) C++
11 5 (0.53%) TypeScript
12 4 (0.42%) MATLAB
13 2 (0.21%) ABAP
13 2 (0.21%) Go
13 2 (0.21%) Kusto Query Language
14 1 (0.11%) Bicep
14 1 (0.11%) C
14 1 (0.11%) RPG IV
Qualifications
1 246 (26.09%) Security Cleared
2 222 (23.54%) SC Cleared
3 144 (15.27%) Degree
4 96 (10.18%) CISSP
5 81 (8.59%) CISM
6 80 (8.48%) ITIL Certification
7 61 (6.47%) SSCP
8 58 (6.15%) DV Cleared
9 33 (3.50%) Cisco Certification
10 21 (2.23%) CCNP
11 16 (1.70%) Microsoft Certification
12 14 (1.48%) CCNA
13 13 (1.38%) Computer Science Degree
14 11 (1.17%) CISA
15 9 (0.95%) CCIE
15 9 (0.95%) GIAC
16 8 (0.85%) A+ Certification
16 8 (0.85%) Azure Certification
17 6 (0.64%) CompTIA Security+
18 5 (0.53%) BPSS Clearance
Quality Assurance & Compliance
1 179 (18.98%) SLA
2 115 (12.20%) ISO/IEC 27001
3 72 (7.64%) GDPR
4 44 (4.67%) NIST
5 26 (2.76%) Cyber Essentials
6 16 (1.70%) QA
7 8 (0.85%) COBIT
8 7 (0.74%) Cyber Essentials PLUS
9 6 (0.64%) GRC
10 5 (0.53%) HIPAA
10 5 (0.53%) PCI DSS
10 5 (0.53%) Sarbanes-Oxley
11 3 (0.32%) ISO 22301
11 3 (0.32%) ISO/IEC 20000
12 2 (0.21%) Def Stans
12 2 (0.21%) Government Security Classifications
12 2 (0.21%) HMG Security Policy Framework
12 2 (0.21%) JSP 440
12 2 (0.21%) NIST 800
12 2 (0.21%) SOC 2
System Software
1 180 (19.09%) Active Directory
2 99 (10.50%) VMware Infrastructure
3 61 (6.47%) Hyper-V
4 24 (2.55%) vSphere
5 21 (2.23%) VMware ESXi
6 18 (1.91%) Docker
7 17 (1.80%) VMware NSX
8 11 (1.17%) Virtual Machines
9 9 (0.95%) Virtual Desktop
10 8 (0.85%) Oracle RAC
11 4 (0.42%) Firmware
11 4 (0.42%) Tivoli Workload Scheduler
12 3 (0.32%) XenApp
13 2 (0.21%) BitLocker
13 2 (0.21%) GPFS
14 1 (0.11%) DFS Replication
14 1 (0.11%) EMC RecoverPoint
14 1 (0.11%) Virtual Servers
Systems Management
1 86 (9.12%) Single Sign-On
2 79 (8.38%) OpenSSO
3 75 (7.95%) SCCM
4 34 (3.61%) Microsoft Intune
5 27 (2.86%) Terraform
6 26 (2.76%) AirWatch
7 25 (2.65%) Kubernetes
8 18 (1.91%) vCenter Server
9 16 (1.70%) Failover Clustering
9 16 (1.70%) Microsoft Clustering
9 16 (1.70%) Microsoft Data Protection Manager
10 14 (1.48%) Grafana
11 13 (1.38%) Ansible
12 12 (1.27%) Prometheus
12 12 (1.27%) SCOM
13 9 (0.95%) Active Directory Federation Services
13 9 (0.95%) NetBackup
14 8 (0.85%) Data Guard
14 8 (0.85%) Oracle RMAN
15 7 (0.74%) Tivoli
Vendors
1 290 (30.75%) Microsoft
2 140 (14.85%) VMware
3 109 (11.56%) ServiceNow
4 104 (11.03%) Oracle
5 84 (8.91%) Cisco
6 72 (7.64%) Remedy
7 27 (2.86%) Palo Alto
8 23 (2.44%) Dell
9 19 (2.01%) Citrix
10 18 (1.91%) IBM
11 17 (1.80%) Juniper
12 16 (1.70%) HP
12 16 (1.70%) Red Hat
13 15 (1.59%) SolarWinds
14 12 (1.27%) Apple
14 12 (1.27%) Meraki
14 12 (1.27%) Qualys
15 11 (1.17%) CheckPoint
15 11 (1.17%) Google
15 11 (1.17%) Sun