IT Service Management (ITSM)
UK

The following table provides summary statistics for permanent job vacancies with a requirement for ITSM skills. Included is a benchmarking guide to the salaries offered in vacancies that have cited ITSM over the 6 months to 3 May 2024 with a comparison to the same period in the previous 2 years.

6 months to
3 May 2024
Same period 2023 Same period 2022
Rank 184 224 328
Rank change year-on-year +40 +104 +12
Permanent jobs citing ITSM 1,586 1,706 1,923
As % of all permanent jobs advertised in the UK 1.61% 1.64% 1.23%
As % of the Processes & Methodologies category 1.87% 1.72% 1.29%
Number of salaries quoted 1,171 1,216 1,395
10th Percentile £26,250 £30,000 £25,500
25th Percentile £32,750 £35,750 £31,250
Median annual salary (50th Percentile) £50,000 £52,000 £50,000
Median % change year-on-year -3.85% +4.00% -
75th Percentile £67,968 £71,652 £63,750
90th Percentile £88,750 £90,000 £77,500
UK excluding London median annual salary £43,586 £45,000 £42,500
% change year-on-year -3.14% +5.88% -

All Process and Methodology Skills
UK

ITSM is in the Processes and Methodologies category. The following table is for comparison with the above and provides summary statistics for all permanent job vacancies with a requirement for process or methodology skills.

Permanent vacancies with a requirement for process or methodology skills 84,746 99,225 149,638
As % of all permanent jobs advertised in the UK 85.94% 95.61% 95.61%
Number of salaries quoted 59,834 58,281 83,297
10th Percentile £29,000 £34,000 £33,500
25th Percentile £40,000 £45,000 £43,750
Median annual salary (50th Percentile) £55,000 £61,500 £60,000
Median % change year-on-year -10.57% +2.50% +9.09%
75th Percentile £72,500 £81,750 £80,000
90th Percentile £92,500 £100,000 £96,250
UK excluding London median annual salary £50,000 £55,000 £52,500
% change year-on-year -9.09% +4.76% +9.38%

ITSM
Job Vacancy Trend

Job postings citing ITSM as a proportion of all IT jobs advertised.
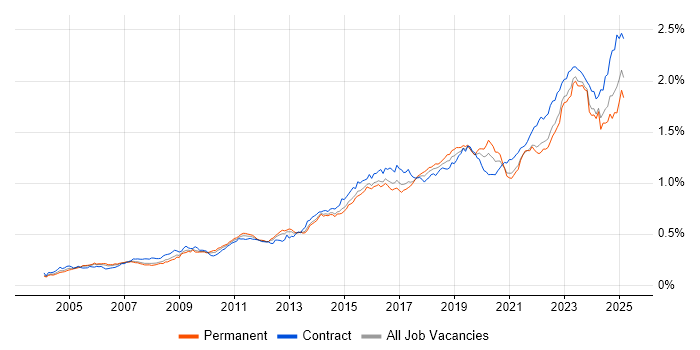
Job vacancy trend for ITSM in the UK

ITSM
Salary Trend

3-month moving average salary quoted in jobs citing ITSM.

Salary trend for ITSM in the UK

ITSM
Salary Histogram

Salary distribution for jobs citing ITSM over the 6 months to 3 May 2024.

Salary histogram for ITSM in the UK

ITSM
Top 18 Job Locations

The table below looks at the demand and provides a guide to the median salaries quoted in IT jobs citing ITSM within the UK over the 6 months to 3 May 2024. The 'Rank Change' column provides an indication of the change in demand within each location based on the same 6 month period last year.

Location Rank Change
on Same Period
Last Year
Matching
Permanent
IT Job Ads
Median Salary
Past 6 Months
Median Salary
% Change
on Same Period
Last Year
Live
Jobs
England +42 1,380 £50,000 - 283
UK excluding London +15 1,011 £43,586 -3.14% 213
Work from Home +34 604 £58,000 +7.03% 107
London +75 494 £62,500 +0.81% 79
North of England +63 292 £41,774 -7.17% 65
South East -32 231 £52,500 +5.00% 41
Midlands -8 168 £47,500 -5.00% 36
North West +30 164 £41,774 -12.05% 34
South West -31 108 £42,500 +11.03% 24
West Midlands -25 102 £59,575 +13.48% 25
Yorkshire +76 92 £41,774 -7.17% 20
East of England +19 77 £36,250 +13.28% 28
Scotland -25 77 £45,000 -28.00% 14
East Midlands +9 64 £25,000 -29.08% 11
Wales +24 45 £47,500 -5.00% 6
North East +5 36 £42,407 +8.73% 11
Northern Ireland +34 11 £30,000 -25.00% 2
Isle of Man - 4 - - 1

ITSM
Co-occurring Skills and Capabilities by Category

The follow tables expand on the table above by listing co-occurrences grouped by category. The same employment type, locality and period is covered with up to 20 co-occurrences shown in each of the following categories:

Application Platforms
1 126 (7.94%) SharePoint
2 119 (7.50%) Microsoft Exchange
3 46 (2.90%) WebLogic
4 45 (2.84%) Oracle Service Bus
5 31 (1.95%) Confluence
6 22 (1.39%) SAS
7 15 (0.95%) CMS
8 6 (0.38%) IBM Notes
8 6 (0.38%) Skype for Business
9 2 (0.13%) Apache
9 2 (0.13%) IIS
9 2 (0.13%) Oracle SOA Suite
9 2 (0.13%) SharePoint Server
10 1 (0.063%) Exchange Server 2013
10 1 (0.063%) WebSphere
Applications
1 238 (15.01%) Microsoft Office
2 107 (6.75%) Microsoft Excel
3 45 (2.84%) MS Visio
4 30 (1.89%) Microsoft PowerPoint
5 2 (0.13%) Chatbot
5 2 (0.13%) Microsoft Project
Business Applications
1 134 (8.45%) Remedy ITSM
2 36 (2.27%) Dynamics CRM
3 22 (1.39%) PlanetPress Connect
4 13 (0.82%) Elite 3E
5 5 (0.32%) Carpe Diem
5 5 (0.32%) NEC Housing
5 5 (0.32%) Oracle EBS
6 4 (0.25%) SAP ERP
6 4 (0.25%) SAP IS-U
6 4 (0.25%) Sparx Enterprise Architect
7 3 (0.19%) NetSuite
7 3 (0.19%) Oracle ERP
8 1 (0.063%) HFM
8 1 (0.063%) Oracle Applications
8 1 (0.063%) Primavera
8 1 (0.063%) Salesforce CRM
8 1 (0.063%) SAP Oil and Gas
Cloud Services
1 379 (23.90%) Microsoft 365
2 251 (15.83%) Azure
3 93 (5.86%) Entra ID
4 58 (3.66%) SaaS
5 56 (3.53%) Power Platform
6 39 (2.46%) AWS
7 38 (2.40%) PaaS
8 36 (2.27%) OneDrive
9 33 (2.08%) IaaS
10 20 (1.26%) WhatsApp
11 19 (1.20%) Dynamics 365
12 15 (0.95%) Cloud Computing
13 13 (0.82%) GCP
13 13 (0.82%) Mimecast
14 12 (0.76%) Power Automate
15 10 (0.63%) Azure Monitor
15 10 (0.63%) Google Workspace
16 9 (0.57%) GitHub
17 8 (0.50%) Azure Sentinel
17 8 (0.50%) PowerApps
Communications & Networking
1 107 (6.75%) Firewall
2 78 (4.92%) TCP/IP
3 73 (4.60%) DNS
4 65 (4.10%) VPN
5 64 (4.04%) WAN
6 60 (3.78%) DHCP
7 53 (3.34%) LAN
8 39 (2.46%) VoIP
9 31 (1.95%) Wi-Fi
10 30 (1.89%) Network Security
11 26 (1.64%) Internet
12 22 (1.39%) Wireless
13 21 (1.32%) SAN
14 20 (1.26%) Remote Desktop
14 20 (1.26%) WLAN
15 16 (1.01%) SSH
16 15 (0.95%) Broadband
16 15 (0.95%) SD-WAN
16 15 (0.95%) Skype
17 13 (0.82%) SNMP
Database & Business Intelligence
1 58 (3.66%) SQL Server
2 50 (3.15%) Oracle Database
3 46 (2.90%) Oracle Database 11g
4 45 (2.84%) Oracle Database 10g
4 45 (2.84%) VLDB
5 36 (2.27%) Power BI
6 35 (2.21%) MySQL
7 26 (1.64%) Data Warehouse
7 26 (1.64%) Relational Database
8 6 (0.38%) Amazon RDS
9 5 (0.32%) Redis
10 4 (0.25%) MongoDB
10 4 (0.25%) SQL Server Integration Services
10 4 (0.25%) SQL Server Reporting Services
11 3 (0.19%) Metadata
11 3 (0.19%) Oracle Database 12c
11 3 (0.19%) SAP HANA
12 2 (0.13%) Data Lake
12 2 (0.13%) Delta Lake
12 2 (0.13%) NoSQL
Development Applications
1 102 (6.43%) JIRA
2 22 (1.39%) SQL Server Management Studio (SSMS)
3 13 (0.82%) Eclipse
4 6 (0.38%) GitLab
5 5 (0.32%) Postman
6 4 (0.25%) AdminStudio
6 4 (0.25%) InstallShield
6 4 (0.25%) MSI
7 3 (0.19%) Git
8 2 (0.13%) PowerBuilder
9 1 (0.063%) JMeter
9 1 (0.063%) Selenium
General
1 545 (34.36%) Social Skills
2 296 (18.66%) Finance
3 237 (14.94%) Analytical Skills
4 108 (6.81%) Public Sector
5 88 (5.55%) Banking
6 87 (5.49%) Legal
7 85 (5.36%) Inclusion and Diversity
8 64 (4.04%) Retail
9 62 (3.91%) Law
10 40 (2.52%) Influencing Skills
11 38 (2.40%) Presentation Skills
12 30 (1.89%) Organisational Skills
13 29 (1.83%) Telecoms
14 18 (1.13%) Financial Institution
14 18 (1.13%) Manufacturing
15 14 (0.88%) Police
16 13 (0.82%) Local Government
17 10 (0.63%) Aerospace
17 10 (0.63%) Documentation Skills
17 10 (0.63%) Investment Banking
Job Titles
1 382 (24.09%) Analyst
2 192 (12.11%) Service Manager
3 167 (10.53%) Support Analyst
4 163 (10.28%) IT Support
5 146 (9.21%) IT Manager
6 140 (8.83%) Architect
7 128 (8.07%) Service Analyst
8 113 (7.12%) Senior
9 111 (7.00%) Lead
10 109 (6.87%) IT Analyst
10 109 (6.87%) Service Desk Analyst
11 88 (5.55%) ServiceNow Architect
12 84 (5.30%) Applications Support
12 84 (5.30%) IT Services Manager
13 78 (4.92%) Delivery Manager
14 77 (4.85%) Service Delivery Manager
15 76 (4.79%) Applications Support Analyst
16 74 (4.67%) Developer
17 68 (4.29%) Support Engineer
18 67 (4.22%) ServiceNow Developer
Libraries, Frameworks & Software Standards
1 76 (4.79%) HTML
2 69 (4.35%) Web Services
3 68 (4.29%) CSS
4 60 (3.78%) AngularJS
5 47 (2.96%) XML
6 43 (2.71%) SOAP
7 38 (2.40%) Twitter Bootstrap
8 35 (2.21%) REST
9 27 (1.70%) LDAP
10 26 (1.64%) JSON
11 20 (1.26%) Ajax
12 16 (1.01%) ODBC
12 16 (1.01%) OLE
13 13 (0.82%) JDBC
13 13 (0.82%) XHTML
14 9 (0.57%) Middleware
15 7 (0.44%) FIX Protocol
16 5 (0.32%) 802.1X
16 5 (0.32%) Node.js
16 5 (0.32%) WebdriverIO
Miscellaneous
1 110 (6.94%) CMDB
2 108 (6.81%) Management Information System
3 72 (4.54%) Driving Licence
4 61 (3.85%) Smartphone
5 58 (3.66%) Data Centre
6 56 (3.53%) Product Ownership
7 51 (3.22%) Onboarding
8 40 (2.52%) Self-Motivation
9 32 (2.02%) Legacy Systems
10 27 (1.70%) Replication
11 20 (1.26%) Enterprise Software
12 18 (1.13%) Public Cloud
13 17 (1.07%) Video Conferencing
14 13 (0.82%) Digital Signage
15 12 (0.76%) iPad
16 11 (0.69%) Hedge funds
16 11 (0.69%) iPhone
17 9 (0.57%) PMI
18 8 (0.50%) EMC VNX
19 7 (0.44%) Cloud Native
Operating Systems
1 405 (25.54%) Windows
2 154 (9.71%) Windows 10
3 117 (7.38%) Windows Server
4 103 (6.49%) Linux
5 66 (4.16%) Unix
6 46 (2.90%) Solaris
7 45 (2.84%) Android
8 44 (2.77%) Apple iOS
9 33 (2.08%) Mac OS
10 20 (1.26%) Windows Server 2008
10 20 (1.26%) Windows Server 2016
11 16 (1.01%) Windows Server 2019
12 15 (0.95%) Windows 7
13 10 (0.63%) Windows Server 2012
14 9 (0.57%) Mac OS X
14 9 (0.57%) Windows Phone
15 4 (0.25%) Red Hat Enterprise Linux
16 3 (0.19%) CentOS
16 3 (0.19%) Rocky
17 2 (0.13%) Windows Vista
Processes & Methodologies
1 898 (56.62%) Service Management
2 844 (53.22%) ITIL
3 409 (25.79%) Service Delivery
4 334 (21.06%) Customer Service
5 295 (18.60%) Problem-Solving
6 213 (13.43%) Change Management
7 208 (13.11%) Incident Management
8 192 (12.11%) Agile
9 182 (11.48%) Continuous Improvement
10 165 (10.40%) Project Management
11 150 (9.46%) Mentoring
11 150 (9.46%) Problem Management
12 144 (9.08%) Stakeholder Management
13 132 (8.32%) Actionable Insight
14 129 (8.13%) Cybersecurity
15 103 (6.49%) Service Catalogue
16 97 (6.12%) Coaching
17 93 (5.86%) Asset Management
18 92 (5.80%) Configuration Management
19 85 (5.36%) Roadmaps
Programming Languages
1 90 (5.67%) JavaScript
2 89 (5.61%) SQL
3 78 (4.92%) PowerShell
4 50 (3.15%) PL/SQL
5 41 (2.59%) Python
6 21 (1.32%) Java
6 21 (1.32%) Perl
7 18 (1.13%) R
8 13 (0.82%) Bash
9 10 (0.63%) RPG
10 6 (0.38%) C#
10 6 (0.38%) T-SQL
11 5 (0.32%) C
11 5 (0.32%) PHP
12 4 (0.25%) ABAP
12 4 (0.25%) VB
13 2 (0.13%) Go
13 2 (0.13%) Ruby
14 1 (0.063%) ProC
14 1 (0.063%) Swift
Qualifications
1 254 (16.02%) Security Cleared
2 253 (15.95%) Degree
3 208 (13.11%) SC Cleared
4 77 (4.85%) ITIL Certification
5 63 (3.97%) Microsoft Certification
6 54 (3.40%) A+ Certification
7 35 (2.21%) Computer Science Degree
8 33 (2.08%) DV Cleared
9 31 (1.95%) PMI Certification
10 28 (1.77%) DBS Check
11 26 (1.64%) Cisco Certification
12 24 (1.51%) ITIL Foundation Certificate
13 23 (1.45%) PMP
14 20 (1.26%) Master's Degree
14 20 (1.26%) MCP
14 20 (1.26%) Network+ Certification
15 18 (1.13%) BPSS Clearance
16 17 (1.07%) CCNA
16 17 (1.07%) MCSA
17 15 (0.95%) CREST Certified
Quality Assurance & Compliance
1 180 (11.35%) SLA
2 61 (3.85%) QA
3 34 (2.14%) COBIT
4 29 (1.83%) ISO/IEC 27001
5 23 (1.45%) Cyber Essentials
6 21 (1.32%) GDPR
7 19 (1.20%) Sarbanes-Oxley
8 18 (1.13%) Accessibility
9 15 (0.95%) Data Quality
10 13 (0.82%) NIST
11 10 (0.63%) NCSC
12 7 (0.44%) Cyber Essentials PLUS
12 7 (0.44%) GRC
13 6 (0.38%) PMO
14 5 (0.32%) ISO/IEC 20000
15 4 (0.25%) ISO 22301
15 4 (0.25%) ISO 9001
15 4 (0.25%) ISO/IEC 27002 (supersedes ISO/IEC 17799)
15 4 (0.25%) PCI DSS
15 4 (0.25%) SOC 2
System Software
1 369 (23.27%) Active Directory
2 75 (4.73%) VMware Infrastructure
3 48 (3.03%) Oracle RAC
4 39 (2.46%) Hyper-V
5 23 (1.45%) VMware ESXi
6 14 (0.88%) Terminal Services
7 13 (0.82%) Docker
8 11 (0.69%) IAG
9 10 (0.63%) Firmware
9 10 (0.63%) Virtual Desktop
10 5 (0.32%) XenDesktop
11 4 (0.25%) Microsoft App-V
11 4 (0.25%) XenApp
12 3 (0.19%) Virtual Machines
13 2 (0.13%) VMware Workstation
14 1 (0.063%) BitLocker
14 1 (0.063%) vSphere
Systems Management
1 108 (6.81%) Microsoft Intune
2 78 (4.92%) SCCM
3 47 (2.96%) Data Guard
4 45 (2.84%) Oracle RMAN
5 32 (2.02%) OpenView
6 23 (1.45%) SCOM
7 18 (1.13%) Single Sign-On
8 15 (0.95%) AirWatch
8 15 (0.95%) vCenter Server
9 14 (0.88%) WMI
10 12 (0.76%) WSUS
11 11 (0.69%) Kubernetes
12 10 (0.63%) Jamf Pro
12 10 (0.63%) Nagios
13 9 (0.57%) ZABBIX
14 8 (0.50%) Ansible
14 8 (0.50%) EMC NetWorker
15 7 (0.44%) HP UCMDB
16 6 (0.38%) Nessus
17 5 (0.32%) Kibana
Vendors
1 554 (34.93%) Microsoft
2 414 (26.10%) ServiceNow
3 134 (8.45%) Remedy
4 122 (7.69%) VMware
5 100 (6.31%) Oracle
6 85 (5.36%) Cisco
7 83 (5.23%) BMC
8 81 (5.11%) HP
9 53 (3.34%) Sun
10 37 (2.33%) Citrix
11 36 (2.27%) Veeam
12 33 (2.08%) Salesforce
13 31 (1.95%) Splunk
14 30 (1.89%) Apple
14 30 (1.89%) Meraki
15 27 (1.70%) SAP
16 24 (1.51%) Google
17 22 (1.39%) FNZ
18 21 (1.32%) Snow
18 21 (1.32%) SolarWinds