AI Job Trends

AI
UK

The table below provides summary statistics and salary benchmarking for jobs requiring AI skills. It covers permanent job vacancies from the 6 months leading up to 25 November 2025, with comparisons to the same periods in the previous two years.

6 months to
25 Nov 2025
Same period 2024 Same period 2023
Rank 7 55 78
Rank change year-on-year +48 +23 +39
Permanent jobs citing AI 7,095 2,744 1,889
As % of all permanent jobs in the UK 13.30% 4.08% 3.67%
As % of the Processes & Methodologies category 15.65% 4.82% 3.91%
Number of salaries quoted 2,010 1,451 1,184
10th Percentile £31,225 £43,750 £43,225
25th Percentile £48,750 £56,500 £53,750
Median annual salary (50th Percentile) £70,000 £77,000 £75,000
Median % change year-on-year -9.09% +2.67% +7.14%
75th Percentile £95,000 £95,000 £92,500
90th Percentile £120,000 £115,000 £115,000
UK excluding London median annual salary £57,500 £70,000 £67,500
% change year-on-year -17.86% +3.70% +12.50%

All Process and Methodology Skills
UK

AI falls under the Processes and Methodologies category. For comparison with the information above, the following table provides summary statistics for all permanent job vacancies requiring process or methodology skills.

Permanent vacancies with a requirement for process or methodology skills 45,329 56,886 48,300
As % of all permanent jobs advertised in the UK 84.95% 84.65% 93.78%
Number of salaries quoted 27,632 29,709 37,183
10th Percentile £28,250 £34,000 £32,500
25th Percentile £36,250 £45,000 £43,750
Median annual salary (50th Percentile) £55,000 £60,000 £60,000
Median % change year-on-year -8.33% - -
75th Percentile £75,000 £79,500 £80,000
90th Percentile £95,000 £97,500 £98,750
UK excluding London median annual salary £47,500 £54,439 £52,500
% change year-on-year -12.75% +3.69% -

AI
Job Vacancy Trend

Historical trend showing the proportion of permanent IT job postings citing AI relative to all permanent IT jobs advertised.
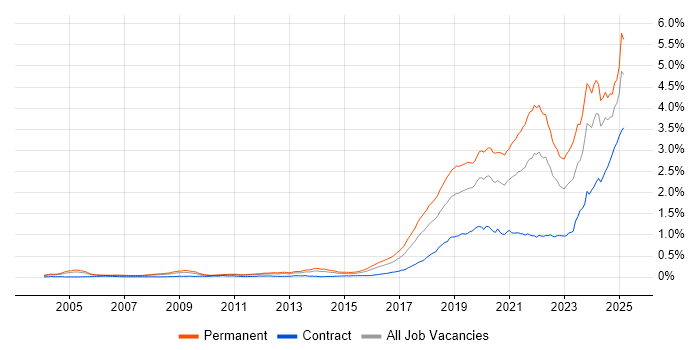
AI job vacancy trend in the UK

AI
Salary Trend

Salary distribution trend for jobs in the UK citing AI.

Salary distribution trend for jobs in the UK citing AI

AI
Salary Histogram

Salary distribution for jobs citing AI over the 6 months to 25 November 2025.

Salary histogram for AI in the UK

AI
Top 18 Job Locations

The table below looks at the demand and provides a guide to the median salaries quoted in IT jobs citing AI within the UK over the 6 months to 25 November 2025. The 'Rank Change' column provides an indication of the change in demand within each location based on the same 6 month period last year.

Location Rank Change
on Same Period
Last Year
Matching
Permanent
IT Job Ads
Median Salary
Past 6 Months
Median Salary
% Change
on Same Period
Last Year
Live
Jobs
England +49 6,143 £70,000 -9.09% 2,613
UK excluding London +56 4,714 £57,500 -17.86% 2,056
Work from Home +68 2,949 £65,000 -13.33% 2,204
London +35 1,973 £80,000 -9.97% 1,087
North of England +64 1,635 £57,500 -14.81% 395
South East +24 1,183 £50,000 -31.03% 925
North West +60 1,095 £57,500 -11.54% 198
Midlands +122 543 £65,000 -10.34% 285
East of England +85 498 £47,500 -44.12% 144
Scotland +68 473 £69,624 +11.40% 97
Yorkshire +55 421 £70,000 - 169
West Midlands +107 334 £65,000 - 179
South West +35 316 £60,000 -7.69% 165
East Midlands +99 207 £60,000 -29.41% 105
North East +65 119 £52,500 -30.92% 30
Wales +42 105 £55,000 +2.33% 37
Northern Ireland -2 34 £90,000 +2.86% 23
Channel Islands +9 6 - - 1

AI
Co-Occurring Skills & Capabilities by Category

The following tables expand on the one above by listing co-occurrences grouped by category. They cover the same employment type, locality and period, with up to 20 co-occurrences shown in each category:

Application Platforms
1 81 (1.14%) SharePoint
2 80 (1.13%) Apache Spark
3 55 (0.78%) Apache Airflow
4 47 (0.66%) CMS
4 47 (0.66%) Confluence
5 28 (0.39%) Apache
6 27 (0.38%) Microsoft Exchange
7 18 (0.25%) WordPress
8 15 (0.21%) Apache Solr
8 15 (0.21%) Oracle SOA Suite
9 9 (0.13%) Oracle Workflow
10 8 (0.11%) Umbraco
11 6 (0.085%) Camunda
11 6 (0.085%) JBoss
11 6 (0.085%) WebSphere
12 5 (0.070%) Appian
13 4 (0.056%) Apache Pulsar
13 4 (0.056%) Drupal
13 4 (0.056%) Luigi
13 4 (0.056%) nginx
Applications
1 1,581 (22.28%) Chatbot
2 260 (3.66%) Microsoft Excel
3 95 (1.34%) Microsoft Office
4 29 (0.41%) Microsoft PowerPoint
5 18 (0.25%) Adobe Premiere
6 14 (0.20%) Maya
7 12 (0.17%) Photoshop
7 12 (0.17%) Sketch
8 10 (0.14%) Adobe Creative Suite
9 9 (0.13%) Adobe After Effects
9 9 (0.13%) Adobe XD
10 7 (0.099%) MS Visio
11 6 (0.085%) Notion
11 6 (0.085%) Spreadsheet
12 5 (0.070%) Simulink
13 4 (0.056%) InDesign
14 3 (0.042%) Final Cut Pro
14 3 (0.042%) Microsoft Project
14 3 (0.042%) S-PLUS
15 2 (0.028%) Weka
Business Applications
1 49 (0.69%) Dynamics CRM
2 19 (0.27%) Oracle ERP
3 17 (0.24%) NetSuite
4 14 (0.20%) SAP S/4HANA
5 10 (0.14%) Oracle Payables
5 10 (0.14%) Shopify
6 7 (0.099%) Endur
7 6 (0.085%) SAP SCM
7 6 (0.085%) Workday HCM
8 5 (0.070%) Elite 3E
8 5 (0.070%) Oracle EBS
8 5 (0.070%) Salesforce CRM
9 3 (0.042%) Oracle Receivables
9 3 (0.042%) SAP Business One
10 2 (0.028%) Dynamics GP
10 2 (0.028%) Oracle General Ledger
10 2 (0.028%) SAP ERP
10 2 (0.028%) SAP FI/CO
10 2 (0.028%) SAP IBP
10 2 (0.028%) Sparx Enterprise Architect
Cloud Services
1 1,652 (23.28%) Cloud Computing
2 1,092 (15.39%) Azure
3 752 (10.60%) AWS
4 501 (7.06%) Power Platform
5 363 (5.12%) SaaS
6 324 (4.57%) GCP
7 218 (3.07%) Azure AI
8 190 (2.68%) GitHub
9 177 (2.49%) Azure DevOps
10 174 (2.45%) Microsoft 365
11 107 (1.51%) Snowflake
12 97 (1.37%) Serverless
13 96 (1.35%) Microsoft Copilot
14 95 (1.34%) Vertex AI
15 81 (1.14%) GitHub Copilot
16 79 (1.11%) Azure Data Factory
17 73 (1.03%) Power Automate
18 71 (1.00%) Entra ID
19 64 (0.90%) Amazon S3
20 60 (0.85%) Amazon Bedrock
Communications & Networking
1 1,621 (22.85%) Internet
2 22 (0.31%) Firewall
3 21 (0.30%) Unified Communications
4 20 (0.28%) VoIP
5 18 (0.25%) Network Security
6 17 (0.24%) VPN
6 17 (0.24%) WAN
7 14 (0.20%) Broadband
7 14 (0.20%) DNS
7 14 (0.20%) Wi-Fi
8 13 (0.18%) TCP/IP
9 11 (0.16%) Wireless
10 10 (0.14%) LAN
11 9 (0.13%) WebEx
12 8 (0.11%) InfiniBand
12 8 (0.11%) Telepresence
12 8 (0.11%) VLAN
13 7 (0.099%) HTTP
13 7 (0.099%) Intranet
13 7 (0.099%) SAN
Database & Business Intelligence
1 375 (5.29%) Power BI
2 228 (3.21%) Tableau
3 161 (2.27%) Data Warehouse
4 133 (1.87%) NoSQL
5 101 (1.42%) SQL Server
6 94 (1.32%) Data Lake
7 91 (1.28%) PostgreSQL
8 85 (1.20%) Big Data
9 81 (1.14%) Metadata
10 80 (1.13%) MongoDB
11 62 (0.87%) MySQL
12 47 (0.66%) Relational Database
13 41 (0.58%) DynamoDB
14 31 (0.44%) Elasticsearch
15 29 (0.41%) Azure SQL Database
16 28 (0.39%) Hadoop
17 27 (0.38%) Data Mining
18 26 (0.37%) BigQuery
18 26 (0.37%) Delta Lake
19 25 (0.35%) SQL Server Integration Services
Development Applications
1 135 (1.90%) Git
2 122 (1.72%) JIRA
3 51 (0.72%) Jenkins
4 40 (0.56%) MLflow
5 22 (0.31%) GitLab
6 19 (0.27%) Octopus Deploy
7 18 (0.25%) TeamCity
7 18 (0.25%) Vite
8 17 (0.24%) Selenium
9 14 (0.20%) Cypress.io
10 12 (0.17%) JUnit
10 12 (0.17%) Oracle Forms
11 10 (0.14%) Maven
12 7 (0.099%) Bitbucket
12 7 (0.099%) Burp Suite
12 7 (0.099%) JMeter
13 6 (0.085%) ERwin
13 6 (0.085%) Postman
13 6 (0.085%) WebDriver
14 5 (0.070%) Subversion
General
1 2,995 (42.21%) Social Skills
2 2,192 (30.89%) Inclusion and Diversity
3 1,862 (26.24%) Banking
4 1,308 (18.44%) Analytical Skills
5 1,189 (16.76%) Finance
6 524 (7.39%) Law
7 511 (7.20%) Marketing
8 283 (3.99%) Public Sector
9 267 (3.76%) Legal
10 230 (3.24%) Retail
11 108 (1.52%) Games
12 106 (1.49%) Manufacturing
13 103 (1.45%) Presentation Skills
14 93 (1.31%) Telecoms
15 83 (1.17%) Pharmaceutical
16 76 (1.07%) Aviation
17 75 (1.06%) Financial Institution
18 70 (0.99%) Organisational Skills
19 67 (0.94%) Electronics
20 62 (0.87%) Influencing Skills
Job Titles
1 1,525 (21.49%) Trainer
2 1,317 (18.56%) Lecturer
3 636 (8.96%) Senior
4 430 (6.06%) Lead
5 380 (5.36%) Developer
6 318 (4.48%) Analyst
7 316 (4.45%) Software Engineer
8 288 (4.06%) Architect
9 184 (2.59%) Data Analyst
10 182 (2.57%) Consultant
11 167 (2.35%) Content Editor
12 140 (1.97%) Junior
13 133 (1.87%) Data Engineer
14 113 (1.59%) Support Specialist
15 112 (1.58%) Junior Analyst
16 111 (1.56%) Junior Data Analyst
17 105 (1.48%) Customer Support Specialist
18 104 (1.47%) Artificial Intelligence Engineer
19 103 (1.45%) Solutions Architect
20 101 (1.42%) Research Scientist
Libraries, Frameworks & Software Standards
1 254 (3.58%) React
2 167 (2.35%) .NET
3 159 (2.24%) REST
4 134 (1.89%) PyTorch
5 125 (1.76%) TensorFlow
6 106 (1.49%) Node.js
7 102 (1.44%) HTML
8 99 (1.40%) Kafka
8 99 (1.40%) RESTful
9 96 (1.35%) Spring
10 89 (1.25%) LangChain
11 78 (1.10%) AngularJS
12 70 (0.99%) FastAPI
13 69 (0.97%) scikit-learn
14 66 (0.93%) CSS
15 60 (0.85%) Django
16 59 (0.83%) Pandas
17 55 (0.78%) Vue
18 54 (0.76%) Hugging Face
19 53 (0.75%) PySpark
Miscellaneous
1 1,627 (22.93%) IoT
2 301 (4.24%) Cloud Native
3 203 (2.86%) Algorithms
4 179 (2.52%) Onboarding
5 170 (2.40%) Product Ownership
6 146 (2.06%) Robotics
7 140 (1.97%) AI Agents
8 124 (1.75%) Self-Motivation
9 119 (1.68%) Molecular Biology
10 101 (1.42%) Management Information System
11 99 (1.40%) Blog
12 96 (1.35%) Enterprise Software
13 89 (1.25%) Distributed Systems
14 88 (1.24%) Legacy Systems
15 82 (1.16%) Analytical Mindset
16 78 (1.10%) Virtual Team
17 75 (1.06%) Life Science
18 73 (1.03%) Greenfield Project
19 68 (0.96%) Low-Code
20 60 (0.85%) Data Centre
Operating Systems
1 88 (1.24%) Windows
2 74 (1.04%) Linux
3 68 (0.96%) Unix
4 62 (0.87%) Android
5 52 (0.73%) Apple iOS
6 44 (0.62%) Windows Server
7 16 (0.23%) Mac OS
8 8 (0.11%) Ubuntu
9 5 (0.070%) Kali Linux
10 4 (0.056%) Windows Server 2019
11 3 (0.042%) OpenWrt
12 2 (0.028%) Mac OS X
12 2 (0.028%) VMS
12 2 (0.028%) zOS
13 1 (0.014%) Debian
13 1 (0.014%) OpenVMS
13 1 (0.014%) Red Hat Enterprise Linux
13 1 (0.014%) Solaris
13 1 (0.014%) Windows Server 2012
13 1 (0.014%) Windows Server 2016
Processes & Methodologies
1 2,750 (38.76%) Machine Learning
2 1,870 (26.36%) User Experience
3 1,866 (26.30%) Cybersecurity
4 1,633 (23.02%) Conversational UI
5 1,628 (22.95%) Web Development
6 1,016 (14.32%) Analytics
7 993 (14.00%) Agile
8 771 (10.87%) Problem-Solving
9 684 (9.64%) Software Engineering
10 638 (8.99%) CI/CD
11 620 (8.74%) Roadmaps
12 612 (8.63%) Continuous Improvement
13 605 (8.53%) Decision-Making
14 574 (8.09%) Chemistry
15 549 (7.74%) DevOps
16 504 (7.10%) Business Intelligence
17 495 (6.98%) Data Science
18 456 (6.43%) Computer Science
19 430 (6.06%) Generative AI
20 418 (5.89%) LLM
Programming Languages
1 1,113 (15.69%) Python
2 734 (10.35%) SQL
3 264 (3.72%) Java
4 235 (3.31%) TypeScript
5 232 (3.27%) JavaScript
6 142 (2.00%) C#
7 87 (1.23%) PowerShell
8 79 (1.11%) C++
9 55 (0.78%) Bash
10 47 (0.66%) R
11 46 (0.65%) Go
12 41 (0.58%) Kotlin
13 33 (0.47%) Data Analysis Expressions
14 30 (0.42%) Bicep
14 30 (0.42%) PHP
14 30 (0.42%) Rust
14 30 (0.42%) Scala
15 23 (0.32%) C
16 22 (0.31%) PL/SQL
17 20 (0.28%) Shell Script
Qualifications
1 3,983 (56.14%) Degree
2 2,675 (37.70%) Master's Degree
3 2,568 (36.19%) PhD
4 1,601 (22.57%) Postgraduate
5 267 (3.76%) Security Cleared
6 227 (3.20%) SC Cleared
7 213 (3.00%) Computer Science Degree
8 145 (2.04%) Azure Certification
9 57 (0.80%) DV Cleared
10 51 (0.72%) BPSS Clearance
11 46 (0.65%) AWS Certification
12 44 (0.62%) DBS Check
13 43 (0.61%) PMP
14 38 (0.54%) ACCA
15 37 (0.52%) Microsoft Certification
16 31 (0.44%) Numerate Degree
17 28 (0.39%) TOGAF Certification
18 27 (0.38%) CISSP
19 23 (0.32%) PMI Certification
20 19 (0.27%) CISA
Quality Assurance & Compliance
1 195 (2.75%) Data Quality
2 111 (1.56%) GDPR
3 110 (1.55%) QA
4 108 (1.52%) Accessibility
5 61 (0.86%) ISO/IEC 27001
6 34 (0.48%) EU AI Act
7 31 (0.44%) Cyber Essentials
8 30 (0.42%) GxP
8 30 (0.42%) SLA
9 27 (0.38%) NIST
10 24 (0.34%) IFRS
11 23 (0.32%) GAAP
11 23 (0.32%) HIPAA
12 22 (0.31%) Solvency II
13 21 (0.30%) PSD2
14 20 (0.28%) PMO
15 19 (0.27%) Actionable Recommendations
16 16 (0.23%) Sarbanes-Oxley
17 15 (0.21%) GRC
18 13 (0.18%) WCAG
System Software
1 245 (3.45%) Docker
2 41 (0.58%) Active Directory
3 22 (0.31%) Virtual Desktop
4 21 (0.30%) VMware Infrastructure
5 18 (0.25%) Virtual Machines
6 11 (0.16%) Hyper-V
7 9 (0.13%) vSphere
8 7 (0.099%) Lustre
9 6 (0.085%) HDFS
10 5 (0.070%) GPFS
10 5 (0.070%) Slurm Workload Manager
11 4 (0.056%) Firmware
11 4 (0.056%) VMware ESXi
12 2 (0.028%) Apache Flume
12 2 (0.028%) Ceph
12 2 (0.028%) NFS
12 2 (0.028%) RACF
13 1 (0.014%) Oracle RAC
13 1 (0.014%) Terminal Server
13 1 (0.014%) Xen
Systems Management
1 256 (3.61%) Kubernetes
2 247 (3.48%) Terraform
3 50 (0.70%) Microsoft Intune
4 42 (0.59%) Ansible
5 32 (0.45%) Kubeflow
6 31 (0.44%) Grafana
6 31 (0.44%) Prometheus
7 27 (0.38%) Single Sign-On
8 9 (0.13%) Argo
8 9 (0.13%) SCCM
9 8 (0.11%) Cisco CUCM
10 4 (0.056%) Active Directory Federation Services
10 4 (0.056%) Nessus
10 4 (0.056%) Nmap
11 3 (0.042%) Functional Safety
11 3 (0.042%) ITRS Geneos
11 3 (0.042%) Netcool
11 3 (0.042%) Netcool/OMNIbus
11 3 (0.042%) Tivoli
11 3 (0.042%) vCenter Server
Vendors
1 1,522 (21.45%) PayPal
2 906 (12.77%) Microsoft
3 232 (3.27%) Google
4 176 (2.48%) Databricks
5 119 (1.68%) Oracle
6 106 (1.49%) Cisco
7 103 (1.45%) OpenAI
8 97 (1.37%) Dell
9 85 (1.20%) Salesforce
10 83 (1.17%) Adobe
11 76 (1.07%) SAP
12 67 (0.94%) Foundry
13 48 (0.68%) Alteryx
13 48 (0.68%) Blue Prism
13 48 (0.68%) Palo Alto
14 44 (0.62%) Apple
14 44 (0.62%) ServiceNow
15 40 (0.56%) HubSpot
16 37 (0.52%) Palantir
17 36 (0.51%) Bloomberg