Project Planning Jobs

Project Planning
UK

The table below provides summary statistics for permanent job vacancies requiring Project Planning skills. It includes a benchmarking guide to the annual salaries offered in vacancies that cited Project Planning over the 6 months leading up to 31 October 2024, comparing them to the same period in the previous two years.

6 months to
31 Oct 2024
Same period 2023 Same period 2022
Rank 409 269 469
Rank change year-on-year -140 +200 -20
Permanent jobs citing Project Planning 432 734 954
As % of all permanent jobs advertised in the UK 0.57% 1.27% 0.69%
As % of the Processes & Methodologies category 0.68% 1.35% 0.72%
Number of salaries quoted 196 291 529
10th Percentile £33,000 £40,000 £37,500
25th Percentile £42,500 £47,381 £46,250
Median annual salary (50th Percentile) £55,000 £58,000 £60,000
Median % change year-on-year -5.17% -3.33% +9.09%
75th Percentile £65,813 £72,500 £72,500
90th Percentile £77,500 £85,000 £90,000
UK excluding London median annual salary £53,159 £52,500 £55,000
% change year-on-year +1.26% -4.55% +10.00%

All Process and Methodology Skills
UK

Project Planning falls under the Processes and Methodologies category. For comparison with the information above, the following table provides summary statistics for all permanent job vacancies requiring process or methodology skills.

Permanent vacancies with a requirement for process or methodology skills 63,881 54,318 133,368
As % of all permanent jobs advertised in the UK 84.08% 94.30% 96.11%
Number of salaries quoted 30,489 39,141 76,332
10th Percentile £34,000 £32,500 £34,000
25th Percentile £45,000 £44,000 £45,000
Median annual salary (50th Percentile) £60,000 £60,000 £60,000
Median % change year-on-year - - +4.35%
75th Percentile £78,000 £80,000 £81,250
90th Percentile £96,250 £97,500 £98,750
UK excluding London median annual salary £54,439 £52,500 £52,500
% change year-on-year +3.69% - +5.00%

Project Planning
Job Vacancy Trend

Job postings citing Project Planning as a proportion of all IT jobs advertised.
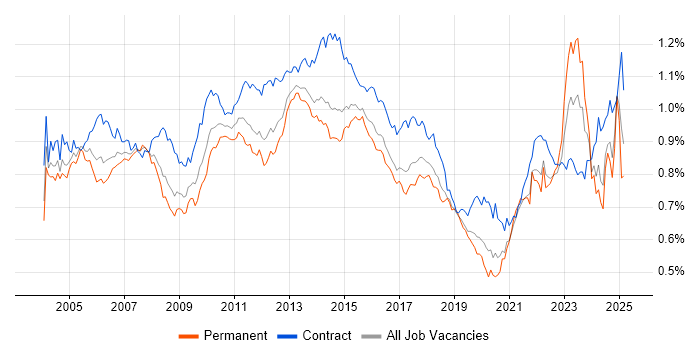
Job vacancy trend for Project Planning in the UK

Project Planning
Salary Trend

3-month moving average salary quoted in jobs citing Project Planning.

Salary trend for Project Planning in the UK

Project Planning
Salary Histogram

Salary distribution for jobs citing Project Planning over the 6 months to 31 October 2024.

Salary histogram for Project Planning in the UK

Project Planning
Top 16 Job Locations

The table below looks at the demand and provides a guide to the median salaries quoted in IT jobs citing Project Planning within the UK over the 6 months to 31 October 2024. The 'Rank Change' column provides an indication of the change in demand within each location based on the same 6 month period last year.

Location Rank Change
on Same Period
Last Year
Matching
Permanent
IT Job Ads
Median Salary
Past 6 Months
Median Salary
% Change
on Same Period
Last Year
Live
Jobs
England -120 402 £55,000 -1.79% 103
UK excluding London -108 343 £53,159 +1.26% 85
South East -31 136 £50,000 - 21
Work from Home -186 94 £57,500 +1.32% 35
London -71 75 £71,250 +1.79% 23
Midlands -51 67 £52,500 +10.53% 15
South West -7 60 £55,000 -4.35% 14
West Midlands -29 45 £52,500 +13.51% 12
North of England -90 35 £50,000 - 19
North West -76 26 £54,500 +6.86% 7
East of England -52 22 £54,000 -1.82% 12
East Midlands -57 22 £54,000 +10.77% 3
Scotland -46 14 £41,455 -33.67% 6
Yorkshire -7 9 £42,500 -15.00% 12
Wales +14 8 £95,000 +65.22%
Northern Ireland -3 1 - - 1

Project Planning
Co-occurring Skills and Capabilities by Category

The follow tables expand on the table above by listing co-occurrences grouped by category. The same employment type, locality and period is covered with up to 20 co-occurrences shown in each of the following categories:

Application Platforms
1 20 (4.63%) SharePoint
2 13 (3.01%) CMS
3 12 (2.78%) Microsoft Exchange
4 9 (2.08%) Kentico
5 8 (1.85%) Umbraco
6 7 (1.62%) Sitecore CMS
6 7 (1.62%) Sitefinity
7 6 (1.39%) Confluence
8 5 (1.16%) ArcGIS
8 5 (1.16%) WordPress
9 2 (0.46%) Office Communications Server
Applications
1 37 (8.56%) Microsoft Project
2 22 (5.09%) Microsoft Office
3 18 (4.17%) Microsoft Excel
4 11 (2.55%) SOLIDWORKS
5 5 (1.16%) Trello
6 4 (0.93%) Adobe XD
6 4 (0.93%) InVision
6 4 (0.93%) Microsoft PowerPoint
6 4 (0.93%) Sketch
6 4 (0.93%) Spreadsheet
6 4 (0.93%) Zeplin
7 3 (0.69%) MS Visio
8 2 (0.46%) AutoCAD
9 1 (0.23%) 3ds Max
9 1 (0.23%) Blender
9 1 (0.23%) Chatbot
9 1 (0.23%) Maya
9 1 (0.23%) OrCAD
9 1 (0.23%) Revit
Business Applications
1 10 (2.31%) SAP S/4HANA
2 7 (1.62%) NetSuite
3 6 (1.39%) Primavera
3 6 (1.39%) SAP CO
3 6 (1.39%) SAP FI
3 6 (1.39%) SAP FI/CO
4 3 (0.69%) Maximo
5 2 (0.46%) SAP PS
6 1 (0.23%) iTrent
6 1 (0.23%) Sage X3
6 1 (0.23%) SAP ERP
Cloud Services
1 22 (5.09%) Azure
2 20 (4.63%) AWS
3 14 (3.24%) Microsoft 365
4 12 (2.78%) Power Platform
5 8 (1.85%) Power Automate
5 8 (1.85%) PowerApps
6 7 (1.62%) SaaS
7 6 (1.39%) GitHub
8 5 (1.16%) Azure DevOps
9 4 (0.93%) Figma
9 4 (0.93%) Miro
9 4 (0.93%) npm
9 4 (0.93%) SuccessFactors
10 3 (0.69%) GCP
11 2 (0.46%) Amazon S3
11 2 (0.46%) AWS Step Functions
11 2 (0.46%) Azure Synapse Analytics
11 2 (0.46%) Cloud Computing
11 2 (0.46%) dbt
11 2 (0.46%) Kontent
Communications & Networking
1 11 (2.55%) Network Security
2 9 (2.08%) Firewall
2 9 (2.08%) HTTP
3 8 (1.85%) HTTPS
4 7 (1.62%) LAN
5 5 (1.16%) TCP/IP
6 4 (0.93%) Internet
6 4 (0.93%) SSL
6 4 (0.93%) VoIP
7 2 (0.46%) 5G
7 2 (0.46%) Cisco ASA
7 2 (0.46%) VPN
7 2 (0.46%) WAN
8 1 (0.23%) Cisco IOS
8 1 (0.23%) Cisco ISE
8 1 (0.23%) NX-OS
8 1 (0.23%) SD-WAN
8 1 (0.23%) Structured Cabling
8 1 (0.23%) Unified Communications
8 1 (0.23%) VPLS
Database & Business Intelligence
1 19 (4.40%) MySQL
2 15 (3.47%) Relational Database
3 10 (2.31%) PostgreSQL
4 9 (2.08%) SQL Server
5 3 (0.69%) Data Warehouse
5 3 (0.69%) Power BI
6 2 (0.46%) Data Lake
6 2 (0.46%) Dremio
6 2 (0.46%) MongoDB
7 1 (0.23%) Azure SQL Database
7 1 (0.23%) FileMaker
7 1 (0.23%) Geospatial Data
7 1 (0.23%) GIS
7 1 (0.23%) Metadata
7 1 (0.23%) NoSQL
7 1 (0.23%) QGIS
7 1 (0.23%) SAP BW
7 1 (0.23%) SAP HANA
7 1 (0.23%) Spatial Data
7 1 (0.23%) SQL Server Reporting Services
Development Applications
1 30 (6.94%) JIRA
2 14 (3.24%) Rational DOORS
3 10 (2.31%) Git
4 5 (1.16%) GitLab
5 4 (0.93%) Bitbucket
5 4 (0.93%) Crucible
5 4 (0.93%) Grunt
5 4 (0.93%) gulp
6 2 (0.46%) Jenkins
7 1 (0.23%) Hudson
7 1 (0.23%) Subversion
General
1 180 (41.67%) Social Skills
2 108 (25.00%) Finance
3 60 (13.89%) Analytical Skills
4 42 (9.72%) Manufacturing
5 38 (8.80%) Public Sector
6 26 (6.02%) Retail
7 25 (5.79%) Legal
8 24 (5.56%) Organisational Skills
9 21 (4.86%) Law
10 15 (3.47%) Telecoms
11 12 (2.78%) Influencing Skills
12 10 (2.31%) Marketing
13 8 (1.85%) Police
14 7 (1.62%) Games
14 7 (1.62%) iGaming
14 7 (1.62%) Inclusion and Diversity
15 5 (1.16%) Aerospace
15 5 (1.16%) Electronics
15 5 (1.16%) Local Government
16 4 (0.93%) Back Office
Job Titles
1 169 (39.12%) Project Manager
2 47 (10.88%) Senior
3 40 (9.26%) Developer
3 40 (9.26%) IT Manager
4 39 (9.03%) Analyst
5 35 (8.10%) IT Project Manager
6 32 (7.41%) Lead
7 25 (5.79%) Senior Manager
7 25 (5.79%) Senior Project Manager
8 23 (5.32%) PMO Analyst
9 21 (4.86%) Architect
10 17 (3.94%) Consultant
11 16 (3.70%) Project Planner
12 15 (3.47%) Governance Analyst
13 14 (3.24%) Principal Engineer
13 14 (3.24%) Principal Systems Engineer
13 14 (3.24%) Solutions Architect
13 14 (3.24%) Technical Manager
14 13 (3.01%) Software Engineer
15 12 (2.78%) Systems Engineer
Libraries, Frameworks & Software Standards
1 17 (3.94%) .NET
2 15 (3.47%) HTML
2 15 (3.47%) Node.js
3 14 (3.24%) React
4 11 (2.55%) REST
5 10 (2.31%) CSS
6 8 (1.85%) Vue
7 6 (1.39%) gRPC
7 6 (1.39%) OAuth
7 6 (1.39%) WebSockets
8 5 (1.16%) HTML5
8 5 (1.16%) Laravel
8 5 (1.16%) React Native
9 4 (0.93%) ADO
9 4 (0.93%) jQuery
9 4 (0.93%) Sass
9 4 (0.93%) Symfony
9 4 (0.93%) Tailwind CSS
10 3 (0.69%) ASP.NET Core
10 3 (0.69%) FHIR
Miscellaneous
1 35 (8.10%) Management Information System
2 29 (6.71%) Self-Motivation
3 20 (4.63%) Product Ownership
4 13 (3.01%) Data Centre
4 13 (3.01%) PMI
5 12 (2.78%) Client/Server
6 11 (2.55%) FMCG
6 11 (2.55%) Onboarding
7 10 (2.31%) Driving Licence
8 7 (1.62%) Data Structures
8 7 (1.62%) Mobile App
9 6 (1.39%) Linux Command Line
10 5 (1.16%) Animation
10 5 (1.16%) Legacy Systems
11 4 (0.93%) Analytical Mindset
11 4 (0.93%) Greenfield Project
12 3 (0.69%) Blog
12 3 (0.69%) Cyberattack
12 3 (0.69%) Renewable Energy
12 3 (0.69%) Virtual Team
Operating Systems
1 19 (4.40%) Linux
2 10 (2.31%) Android
2 10 (2.31%) Apple iOS
3 8 (1.85%) Unix
4 6 (1.39%) Windows
5 3 (0.69%) Embedded Linux
6 2 (0.46%) Mac OS
6 2 (0.46%) Windows 10
7 1 (0.23%) Windows Server
Processes & Methodologies
1 201 (46.53%) Project Management
2 149 (34.49%) Project Delivery
3 110 (25.46%) Problem-Solving
4 96 (22.22%) Agile
5 89 (20.60%) Stakeholder Management
6 78 (18.06%) Budget Management
7 67 (15.51%) Risk Management
8 46 (10.65%) Requirements Gathering
9 45 (10.42%) PRINCE2
10 44 (10.19%) Change Management
11 43 (9.95%) Roadmaps
12 38 (8.80%) Software Engineering
13 37 (8.56%) Resource Allocation
14 35 (8.10%) Requirements Management
15 33 (7.64%) Continuous Improvement
16 32 (7.41%) Contingency Planning
17 31 (7.18%) Scrum
18 29 (6.71%) Collaborative Working
18 29 (6.71%) Presales
19 28 (6.48%) Stakeholder Engagement
Programming Languages
1 46 (10.65%) SQL
2 25 (5.79%) JavaScript
3 24 (5.56%) C++
4 20 (4.63%) Python
5 16 (3.70%) PHP
6 8 (1.85%) C#
7 7 (1.62%) C
8 6 (1.39%) Java
9 3 (0.69%) Embedded C
9 3 (0.69%) Embedded C++
10 2 (0.46%) ABAP
11 1 (0.23%) PowerShell
11 1 (0.23%) T-SQL
11 1 (0.23%) VBA
Qualifications
1 125 (28.94%) Degree
2 43 (9.95%) Security Cleared
3 28 (6.48%) PMI Certification
4 27 (6.25%) SC Cleared
5 24 (5.56%) PMP
6 15 (3.47%) Computer Science Degree
7 11 (2.55%) Chartered Engineer
8 8 (1.85%) PRINCE2 Certification
9 5 (1.16%) DBS Check
10 4 (0.93%) AWS Certification
10 4 (0.93%) BPSS Clearance
11 3 (0.69%) APMG
11 3 (0.69%) Cisco Certification
11 3 (0.69%) PRINCE2 Practitioner
12 2 (0.46%) APMP
12 2 (0.46%) CCNP
12 2 (0.46%) DV Cleared
12 2 (0.46%) ISTQB
12 2 (0.46%) Master's Degree
12 2 (0.46%) Microsoft Certification
Quality Assurance & Compliance
1 49 (11.34%) PMO
2 45 (10.42%) QA
3 15 (3.47%) P3O
3 15 (3.47%) SLA
4 8 (1.85%) Data Quality
4 8 (1.85%) GDPR
5 6 (1.39%) COBIT
5 6 (1.39%) NIST
6 5 (1.16%) Accessibility
7 3 (0.69%) HL7
8 1 (0.23%) California Consumer Privacy Act
8 1 (0.23%) ISO/IEC 27001
8 1 (0.23%) PMBOK
System Software
1 9 (2.08%) Firmware
2 4 (0.93%) Embedded Firmware
3 2 (0.46%) Active Directory
3 2 (0.46%) Docker
Systems Management
1 4 (0.93%) Kubernetes
2 2 (0.46%) Ansible
2 2 (0.46%) FortiGate
2 2 (0.46%) Terraform
Vendors
1 67 (15.51%) Microsoft
2 23 (5.32%) SAP
3 16 (3.70%) Oracle
4 10 (2.31%) Sage
5 9 (2.08%) NEC
6 8 (1.85%) Optimizely
6 8 (1.85%) Sitecore
7 7 (1.62%) Epicor
8 5 (1.16%) Salesforce
8 5 (1.16%) WatchGuard
9 4 (0.93%) Adobe
9 4 (0.93%) ESRI
9 4 (0.93%) Google
10 3 (0.69%) Ariba
10 3 (0.69%) IBM
11 2 (0.46%) BT
11 2 (0.46%) Cisco
11 2 (0.46%) Fortinet
11 2 (0.46%) ServiceNow
12 1 (0.23%) SnapLogic