Redux Contracts in the City of London

Redux
Central London > City of London

The table below provides summary statistics for contract job vacancies advertised in the City of London requiring Redux skills. It includes a benchmarking guide to the contractor rates offered in vacancies that cited Redux over the 6 months leading up to 17 July 2025, comparing them to the same period in the previous two years.

6 months to
17 Jul 2025
Same period 2024 Same period 2023
Rank 115 127 147
Rank change year-on-year +12 +20 +7
Contract jobs citing Redux 9 4 23
As % of all contract jobs advertised in the City of London 0.48% 0.19% 0.66%
As % of the Libraries, Frameworks & Software Standards category 1.89% 0.81% 2.53%
Number of daily rates quoted 8 4 13
10th Percentile £543 £424 -
25th Percentile £588 £461 £750
Median daily rate (50th Percentile) £608 £519 £800
Median % change year-on-year +17.20% -35.16% +18.52%
75th Percentile £679 £619 £875
90th Percentile £738 £698 -
Central London median daily rate £608 £519 £800
% change year-on-year +17.20% -35.16% +18.52%

All Software Libraries and Frameworks
City of London

Redux falls under the Software Libraries and Frameworks category. For comparison with the information above, the following table provides summary statistics for all contract job vacancies requiring technical specification, industry standards, software libraries and framework skills in the City of London.

Contract vacancies with a requirement for technical specification, industry standards, software libraries and framework skills 477 493 910
As % of all contract IT jobs advertised in the City of London 25.62% 23.06% 26.29%
Number of daily rates quoted 308 335 582
10th Percentile £404 £409 £413
25th Percentile £450 £475 £500
Median daily rate (50th Percentile) £575 £575 £625
Median % change year-on-year - -8.00% +4.17%
75th Percentile £675 £709 £750
90th Percentile £754 £822 £830
Central London median daily rate £550 £575 £625
% change year-on-year -4.35% -8.00% +4.17%
Number of hourly rates quoted 2 0 1
10th Percentile £63.75 - -
25th Percentile £67.50 - -
Median hourly rate £75.00 - £53.00
Median % change year-on-year - - +11.58%
75th Percentile £82.50 - -
90th Percentile £86.25 - -
Central London median hourly rate £62.50 - £53.00
% change year-on-year - - +11.58%

Redux
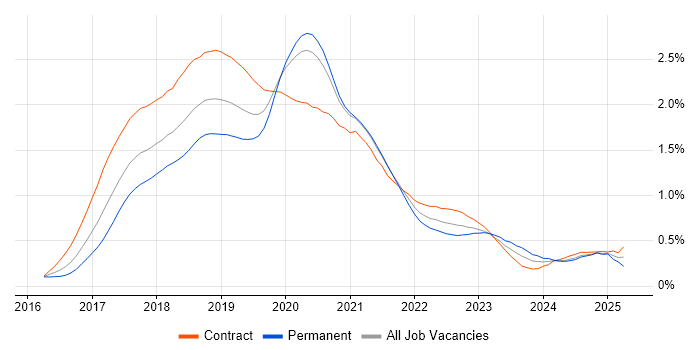
Job Vacancy Trend in the City of London

Job postings citing Redux as a proportion of all IT jobs advertised in the City of London.

Job vacancy trend for Redux in the City of London

Redux
Contractor Daily Rate Trend in the City of London

3-month moving average daily rate quoted in jobs citing Redux in the City of London.

Daily rate trend for Redux in the City of London

Redux
Daily Rate Histogram in the City of London

Daily rate distribution for jobs citing Redux in the City of London over the 6 months to 17 July 2025.

Daily rate histogram for Redux in the City of London

Redux
Co-occurring Skills and Capabilities in the City of London by Category

The follow tables expand on the table above by listing co-occurrences grouped by category. The same employment type, locality and period is covered with up to 20 co-occurrences shown in each of the following categories:

Cloud Services
1 3 (33.33%) AWS
1 3 (33.33%) npm
1 3 (33.33%) Yarn
2 2 (22.22%) Google Play
3 1 (11.11%) Azure
3 1 (11.11%) Figma
3 1 (11.11%) Firebase
3 1 (11.11%) GCP
Database & Business Intelligence
1 2 (22.22%) MongoDB
1 2 (22.22%) NoSQL
Development Applications
1 4 (44.44%) webpack
2 3 (33.33%) Babel
2 3 (33.33%) Git
3 2 (22.22%) Ant
3 2 (22.22%) Jenkins
3 2 (22.22%) TeamCity
4 1 (11.11%) Storybook
4 1 (11.11%) Vite
General
1 3 (33.33%) Banking
1 3 (33.33%) Finance
1 3 (33.33%) Social Skills
2 1 (11.11%) Advertising
Job Titles
1 5 (55.56%) Developer
1 5 (55.56%) React Developer
2 2 (22.22%) Front-End Developer (Client-Side Developer)
3 1 (11.11%) Architect
3 1 (11.11%) Electronic Trading Developer
3 1 (11.11%) Electronic Trading Specialist
3 1 (11.11%) JavaScript Engineer
3 1 (11.11%) Mobile Architect
3 1 (11.11%) Technical Architect
3 1 (11.11%) UI Engineer
Libraries, Frameworks & Software Standards
1 7 (77.78%) React
1 7 (77.78%) RESTful
2 4 (44.44%) CSS
3 3 (33.33%) HTML
4 2 (22.22%) .NET
4 2 (22.22%) CSS3
4 2 (22.22%) HTML5
4 2 (22.22%) Material-UI
4 2 (22.22%) React Native
4 2 (22.22%) Semantic UI
4 2 (22.22%) Web Services
4 2 (22.22%) WPF
5 1 (11.11%) Apollo GraphQL
5 1 (11.11%) GraphQL
5 1 (11.11%) Jest
5 1 (11.11%) JWT
5 1 (11.11%) Next.js
5 1 (11.11%) OAuth2
5 1 (11.11%) REST
5 1 (11.11%) Spring Boot
Miscellaneous
1 3 (33.33%) Mobile App
2 1 (11.11%) Product Ownership
Operating Systems
1 1 (11.11%) Android
1 1 (11.11%) Apple iOS
Processes & Methodologies
1 6 (66.67%) CI/CD
1 6 (66.67%) User Experience
2 5 (55.56%) Agile
3 3 (33.33%) Analytics
3 3 (33.33%) DevOps
3 3 (33.33%) Fintech
3 3 (33.33%) Microservices
3 3 (33.33%) UX Design
4 2 (22.22%) A/B Testing
4 2 (22.22%) Asynchronous Programming
4 2 (22.22%) Business Case
4 2 (22.22%) Continuous Delivery
4 2 (22.22%) Continuous Integration
4 2 (22.22%) Deployment Automation
4 2 (22.22%) Front End Development
4 2 (22.22%) Functional Programming
4 2 (22.22%) Mobile Application Development
4 2 (22.22%) Stakeholder and Relationship Management
4 2 (22.22%) Wireframes
5 1 (11.11%) Electronic Trading
Programming Languages
1 8 (88.89%) JavaScript
2 5 (55.56%) TypeScript
3 2 (22.22%) C#
3 2 (22.22%) SQL
4 1 (11.11%) Java
4 1 (11.11%) Kotlin
4 1 (11.11%) Objective-C
4 1 (11.11%) Swift
Quality Assurance & Compliance
1 1 (11.11%) Accessibility
1 1 (11.11%) WCAG
Vendors
1 2 (22.22%) Google