GCP Contract Job Trends in the City of London

Google Cloud Platform (GCP)
Central London > City of London

The table below provides summary statistics and contractor rates for jobs advertised in the City of London requiring GCP skills. It covers vacancies from the 6 months leading up to 16 September 2025, with comparisons to the same periods in the previous two years.

6 months to
16 Sep 2025
Same period 2024 Same period 2023
Rank 42 54 43
Rank change year-on-year +12 -11 +52
Contract jobs citing GCP 92 77 139
As % of all contract jobs advertised in the City of London 5.23% 3.72% 4.57%
As % of the Cloud Services category 12.99% 9.20% 10.98%
Number of daily rates quoted 63 52 106
10th Percentile £386 £414 £466
25th Percentile £495 £460 £535
Median daily rate (50th Percentile) £600 £580 £649
Median % change year-on-year +3.45% -10.56% +3.76%
75th Percentile £678 £709 £762
90th Percentile £760 £824 £925
Central London median daily rate £600 £566 £649
% change year-on-year +6.05% -12.76% +3.76%
Number of hourly rates quoted 2 0 0
10th Percentile £47.13 - -
25th Percentile £55.94 - -
Median hourly rate £71.25 - -
75th Percentile £85.94 - -
90th Percentile £94.38 - -
Central London median hourly rate £51.44 - -

All Cloud Skills
City of London

GCP falls under the Cloud Services category. For comparison with the information above, the following table provides summary statistics for all contract job vacancies requiring cloud computing skills in the City of London.

Contract vacancies with a requirement for cloud computing skills 708 837 1,266
As % of all contract IT jobs advertised in the City of London 40.25% 40.45% 41.60%
Number of daily rates quoted 487 553 865
10th Percentile £337 £397 £325
25th Percentile £433 £475 £463
Median daily rate (50th Percentile) £550 £565 £575
Median % change year-on-year -2.65% -1.74% -
75th Percentile £668 £675 £688
90th Percentile £753 £775 £800
Central London median daily rate £550 £563 £563
% change year-on-year -2.22% - -2.17%
Number of hourly rates quoted 12 3 6
10th Percentile £23.84 - £14.63
25th Percentile £26.23 - £17.00
Median hourly rate £34.33 £27.00 £20.75
Median % change year-on-year +27.13% +30.12% -38.97%
75th Percentile £58.96 £59.75 £34.44
90th Percentile £86.43 £79.40 £45.25
Central London median hourly rate £34.00 £35.00 £20.75
% change year-on-year -2.86% +68.67% -37.59%

GCP
Job Vacancy Trend in the City of London

Job postings citing GCP as a proportion of all IT jobs advertised in the City of London.
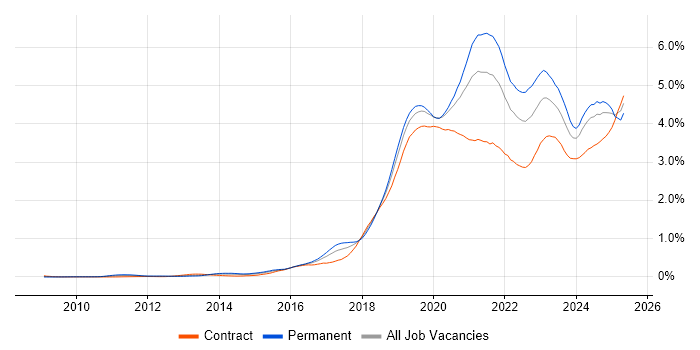
Job vacancy trend for GCP in the City of London

GCP
Daily Rate Trend in the City of London

Contractor daily rate distribution trend for jobs in the City of London citing GCP.

Contractor daily rate distribution trend for jobs in the City of London citing GCP

GCP
Daily Rate Histogram in the City of London

Daily rate distribution for jobs citing GCP in the City of London over the 6 months to 16 September 2025.

Daily rate histogram for GCP in the City of London

GCP
Hourly Rate Trend in the City of London

Contractor hourly rate distribution trend for jobs in the City of London citing GCP.

Contractor hourly rate distribution trend for jobs in the City of London citing GCP

GCP
Hourly Rate Histogram in the City of London

Hourly rate distribution of jobs citing GCP in the City of London over the 6 months to 16 September 2025.

Hourly rate histogram for GCP in the City of London

GCP
Contract Job Locations in the City of London

The table below looks at the demand and provides a guide to the median contractor rates quoted in IT jobs citing GCP within the City of London region over the 6 months to 16 September 2025. The 'Rank Change' column provides an indication of the change in demand within each location based on the same 6 month period last year.

Location Rank Change
on Same Period
Last Year
Matching
Contract
IT Job Ads
Median
Daily Rate
Past 6 Months
Median Daily Rate
% Change
on Same Period
Last Year
Live
Jobs
London Bridge - 1 - -
GCP
Central London

GCP
Co-occurring Skills and Capabilities in the City of London by Category

The follow tables expand on the table above by listing co-occurrences grouped by category. The same employment type, locality and period is covered with up to 20 co-occurrences shown in each of the following categories:

Application Platforms
1 4 (4.35%) Apache Airflow
1 4 (4.35%) Apache Spark
2 3 (3.26%) Luigi
2 3 (3.26%) SharePoint
3 2 (2.17%) SAS
4 1 (1.09%) Apache
4 1 (1.09%) Jupyter
Applications
1 3 (3.26%) Microsoft Excel
Business Applications
1 4 (4.35%) Dynamics CRM
2 1 (1.09%) Exchequer
Cloud Services
1 51 (55.43%) Azure
2 46 (50.00%) AWS
3 15 (16.30%) Google Kubernetes Engine
4 7 (7.61%) Cloud Functions
4 7 (7.61%) GitHub
4 7 (7.61%) Power Platform
5 6 (6.52%) Snowflake
6 5 (5.43%) Cloud Run
7 4 (4.35%) Apigee
7 4 (4.35%) GitHub Actions
7 4 (4.35%) IaaS
7 4 (4.35%) PaaS
7 4 (4.35%) SaaS
7 4 (4.35%) Slack
8 3 (3.26%) Azure Machine Learning
8 3 (3.26%) Cloud Composer
8 3 (3.26%) Entra ID
8 3 (3.26%) Google Gemini
8 3 (3.26%) OCI
8 3 (3.26%) Vertex AI
Communications & Networking
1 6 (6.52%) Firewall
2 3 (3.26%) DNS
2 3 (3.26%) VPN
3 2 (2.17%) Internet
3 2 (2.17%) Network Security
4 1 (1.09%) BGP
4 1 (1.09%) LAN
4 1 (1.09%) OSPF
4 1 (1.09%) Software-Defined Networking
4 1 (1.09%) SSL
4 1 (1.09%) TCP/IP
4 1 (1.09%) VLAN
4 1 (1.09%) WAN
4 1 (1.09%) Wi-Fi
4 1 (1.09%) Wireshark
Database & Business Intelligence
1 16 (17.39%) BigQuery
2 10 (10.87%) Big Data
3 9 (9.78%) Data Warehouse
4 7 (7.61%) NoSQL
4 7 (7.61%) Power BI
5 6 (6.52%) Relational Database
6 4 (4.35%) Data Lake
6 4 (4.35%) MongoDB
6 4 (4.35%) PostgreSQL
7 3 (3.26%) Hadoop
7 3 (3.26%) Metadata
7 3 (3.26%) Tableau
8 2 (2.17%) Base SAS
8 2 (2.17%) Looker
8 2 (2.17%) Parquet
8 2 (2.17%) RDBMS
8 2 (2.17%) Snowflake Schema
8 2 (2.17%) Star Schema
9 1 (1.09%) MySQL
9 1 (1.09%) SQL Server
Development Applications
1 8 (8.70%) GitLab
2 7 (7.61%) Gradle
2 7 (7.61%) Maven
3 5 (5.43%) Jenkins
3 5 (5.43%) SonarQube
4 4 (4.35%) Selenium
5 3 (3.26%) MLflow
6 2 (2.17%) Snyk
7 1 (1.09%) Ant
7 1 (1.09%) ER Studio
7 1 (1.09%) JIRA
7 1 (1.09%) JUnit
7 1 (1.09%) Postman
General
1 30 (32.61%) Finance
2 20 (21.74%) Social Skills
3 18 (19.57%) Banking
4 8 (8.70%) Analytical Skills
5 7 (7.61%) Investment Banking
6 6 (6.52%) Marketing
7 5 (5.43%) Public Sector
7 5 (5.43%) Telecoms
8 4 (4.35%) Financial Institution
9 2 (2.17%) Back Office
9 2 (2.17%) Documentation Skills
9 2 (2.17%) Influencing Skills
9 2 (2.17%) Retail
10 1 (1.09%) Advertising
10 1 (1.09%) Front Office
10 1 (1.09%) Inclusion and Diversity
10 1 (1.09%) Military
10 1 (1.09%) Presentation Skills
Job Titles
1 17 (18.48%) Architect
1 17 (18.48%) Senior
2 15 (16.30%) Developer
3 13 (14.13%) GCP Engineer
4 11 (11.96%) Data Engineer
5 9 (9.78%) Security Engineer
6 7 (7.61%) Lead
6 7 (7.61%) Senior Architect
7 6 (6.52%) Analyst
7 6 (6.52%) Java Developer
8 5 (5.43%) Data Analyst
8 5 (5.43%) Lead Developer
8 5 (5.43%) Lead Java Developer
8 5 (5.43%) Project Manager
9 4 (4.35%) Data Architect
9 4 (4.35%) Marketing Manager
9 4 (4.35%) Security Architect
9 4 (4.35%) Senior Manager
9 4 (4.35%) Senior Marketing Manager
10 3 (3.26%) Principal Developer
Libraries, Frameworks & Software Standards
1 9 (9.78%) Spring
1 9 (9.78%) Spring Boot
2 6 (6.52%) GraphQL
2 6 (6.52%) Kafka
3 5 (5.43%) Node.js
4 4 (4.35%) JWT
4 4 (4.35%) OAuth
4 4 (4.35%) OAuth2
4 4 (4.35%) React
4 4 (4.35%) REST
4 4 (4.35%) RESTful
5 3 (3.26%) JSON
5 3 (3.26%) Redux
5 3 (3.26%) Zustand
6 2 (2.17%) Apache Avro
6 2 (2.17%) CSS3
6 2 (2.17%) HTML5
6 2 (2.17%) Symfony
6 2 (2.17%) Tailwind CSS
6 2 (2.17%) WebSockets
Miscellaneous
1 12 (13.04%) Cloud Native
2 7 (7.61%) Data Centre
3 4 (4.35%) Hybrid Cloud
3 4 (4.35%) Product Ownership
4 3 (3.26%) Algorithms
4 3 (3.26%) Equities
4 3 (3.26%) IVR
5 2 (2.17%) Blockchain
5 2 (2.17%) Distributed Systems
5 2 (2.17%) Greenfield Project
5 2 (2.17%) Onboarding
5 2 (2.17%) Public Cloud
5 2 (2.17%) Renewable Energy
5 2 (2.17%) Self-Motivation
6 1 (1.09%) AI Agents
6 1 (1.09%) Cyber Kill Chain
6 1 (1.09%) Enterprise Cloud
6 1 (1.09%) Legacy Systems
6 1 (1.09%) Security Posture
6 1 (1.09%) Virtual Team
Operating Systems
1 6 (6.52%) Linux
2 3 (3.26%) Unix
2 3 (3.26%) Windows
3 1 (1.09%) Android
3 1 (1.09%) Apple iOS
3 1 (1.09%) Windows Server
Processes & Methodologies
1 25 (27.17%) CI/CD
2 23 (25.00%) DevOps
3 18 (19.57%) Agile
4 17 (18.48%) Analytics
5 16 (17.39%) Migration
6 15 (16.30%) Machine Learning
6 15 (16.30%) Stakeholder Management
7 14 (15.22%) Artificial Intelligence
7 14 (15.22%) Cloud Security
7 14 (15.22%) Containerisation
7 14 (15.22%) Data Modelling
7 14 (15.22%) Infrastructure as Code
8 13 (14.13%) Data Engineering
8 13 (14.13%) Microservices
8 13 (14.13%) Problem-Solving
9 12 (13.04%) Cybersecurity
9 12 (13.04%) Roadmaps
10 10 (10.87%) SDLC
11 9 (9.78%) Data Pipeline
12 8 (8.70%) Business Strategy
Programming Languages
1 34 (36.96%) Python
2 29 (31.52%) SQL
3 25 (27.17%) Java
4 8 (8.70%) JavaScript
5 5 (5.43%) Scala
6 4 (4.35%) TypeScript
7 3 (3.26%) PowerShell
8 2 (2.17%) Bash
8 2 (2.17%) Bicep
8 2 (2.17%) DAML
8 2 (2.17%) Data Analysis Expressions
8 2 (2.17%) PROC SQL
8 2 (2.17%) R
9 1 (1.09%) Go
9 1 (1.09%) Groovy
9 1 (1.09%) Kusto Query Language
9 1 (1.09%) LookML
9 1 (1.09%) Objective-C
9 1 (1.09%) SAS Macro
9 1 (1.09%) Shell Script
Qualifications
1 9 (9.78%) CISSP
2 8 (8.70%) Security Cleared
3 5 (5.43%) Degree
3 5 (5.43%) SC Cleared
4 4 (4.35%) CISM
5 2 (2.17%) Azure Certification
5 2 (2.17%) DV Cleared
5 2 (2.17%) Master's Degree
5 2 (2.17%) PMI Certification
5 2 (2.17%) PMP
6 1 (1.09%) AWS Certified Solutions Architect
6 1 (1.09%) CEH
6 1 (1.09%) Cisco Certification
6 1 (1.09%) Computer Science Degree
6 1 (1.09%) GCFA
6 1 (1.09%) GCIA
6 1 (1.09%) GCIH
6 1 (1.09%) MCP
6 1 (1.09%) SnowPro
6 1 (1.09%) TOGAF Certification
Quality Assurance & Compliance
1 10 (10.87%) GDPR
1 10 (10.87%) ISO/IEC 27001
2 8 (8.70%) NIST
3 6 (6.52%) Data Quality
4 4 (4.35%) SOC 2
5 2 (2.17%) California Consumer Privacy Act
6 1 (1.09%) Accessibility
6 1 (1.09%) EU AI Act
6 1 (1.09%) PCI DSS
System Software
1 14 (15.22%) Docker
2 3 (3.26%) Active Directory
3 1 (1.09%) Hyper-V
3 1 (1.09%) VMware Infrastructure
3 1 (1.09%) VMware NSX
Systems Management
1 27 (29.35%) Terraform
2 19 (20.65%) Kubernetes
3 5 (5.43%) Argo
4 4 (4.35%) Ansible
4 4 (4.35%) Istio
5 3 (3.26%) Puppet
6 2 (2.17%) Microsoft Intune
6 2 (2.17%) Progress Chef
6 2 (2.17%) Single Sign-On
7 1 (1.09%) Grafana
7 1 (1.09%) Prometheus
Vendors
1 47 (51.09%) Google
2 12 (13.04%) Microsoft
3 7 (7.61%) Databricks
4 5 (5.43%) Oracle
5 4 (4.35%) Adobe
5 4 (4.35%) Cisco
5 4 (4.35%) MuleSoft
5 4 (4.35%) OpenAI
5 4 (4.35%) Palo Alto
5 4 (4.35%) Salesforce
5 4 (4.35%) Splunk
6 3 (3.26%) Citrix
7 2 (2.17%) BT
7 2 (2.17%) CyberArk
7 2 (2.17%) Okta
7 2 (2.17%) VMware
8 1 (1.09%) Kony
8 1 (1.09%) Ping Identity
8 1 (1.09%) Workday
8 1 (1.09%) Zscaler