Docker Contract Job Trends in the City of London

Docker
Central London > City of London

The table below provides summary statistics and contractor rates for jobs advertised in the City of London requiring Docker skills. It covers contract job vacancies from the 6 months leading up to 21 October 2025, with comparisons to the same periods in the previous two years.

6 months to
21 Oct 2025
Same period 2024 Same period 2023
Rank 54 39 49
Rank change year-on-year -15 +10 -9
Contract jobs citing Docker 64 106 115
As % of all contract jobs in the City of London 3.77% 5.03% 4.01%
As % of the System Software category 41.29% 42.91% 34.95%
Number of daily rates quoted 54 63 85
10th Percentile £428 £489 £400
25th Percentile £513 £538 £470
Median daily rate (50th Percentile) £610 £600 £625
Median % change year-on-year +1.67% -4.00% -3.85%
75th Percentile £673 £725 £788
90th Percentile £761 £815 £850
Central London median daily rate £610 £600 £625
% change year-on-year +1.67% -4.00% -3.85%

All System Software Skills
City of London

Docker falls under the System Software category. For comparison with the information above, the following table provides summary statistics for all contract job vacancies requiring system software skills in the City of London.

Contract vacancies with a requirement for system software skills 155 247 329
As % of all contract IT jobs advertised in the City of London 9.14% 11.72% 11.48%
Number of daily rates quoted 110 158 230
10th Percentile £293 £319 £262
25th Percentile £463 £425 £425
Median daily rate (50th Percentile) £571 £553 £525
Median % change year-on-year +3.25% +5.38% -8.70%
75th Percentile £668 £663 £688
90th Percentile £688 £730 £813
Central London median daily rate £550 £550 £525
% change year-on-year - +4.76% -4.55%
Number of hourly rates quoted 2 3 2
10th Percentile £22.48 £84.40 £23.88
25th Percentile £23.19 £94.75 £27.81
Median hourly rate £25.25 £112.00 £36.25
Median % change year-on-year -77.46% +208.97% +76.83%
75th Percentile £28.19 - £45.31
90th Percentile £29.43 - £49.63
Central London median hourly rate £25.25 £112.00 £36.25
% change year-on-year -77.46% +208.97% +79.01%

Docker
Job Vacancy Trend in the City of London

Historical trend showing the proportion of contract IT job postings citing Docker relative to all contract IT jobs advertised in the City of London.
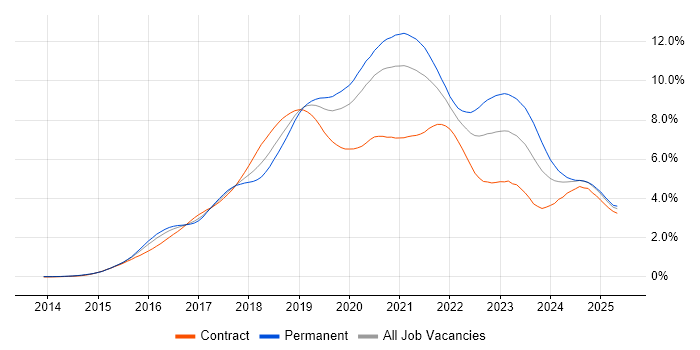
Docker job vacancy trend in the City of London

Docker
Daily Rate Trend in the City of London

Contractor daily rate distribution trend for jobs in the City of London citing Docker.

Contractor daily rate distribution trend for jobs in the City of London citing Docker

Docker
Daily Rate Histogram in the City of London

Daily rate distribution for jobs citing Docker in the City of London over the 6 months to 21 October 2025.

Daily rate histogram for Docker in the City of London

Docker
Hourly Rate Trend in the City of London

Contractor hourly rate distribution trend for jobs in the City of London citing Docker.

Contractor hourly rate distribution trend for jobs in the City of London citing Docker

Docker
Co-Occurring Skills & Capabilities in the City of London by Category

The following tables expand on the one above by listing co-occurrences grouped by category. They cover the same employment type, locality and period, with up to 20 co-occurrences shown in each category:

Application Platforms
1 3 (4.69%) Confluence
2 1 (1.56%) Apache Spark
2 1 (1.56%) Drupal
2 1 (1.56%) nginx
2 1 (1.56%) OpenStack
Cloud Services
1 28 (43.75%) AWS
2 18 (28.13%) Azure
3 17 (26.56%) GCP
4 14 (21.88%) GitHub
5 10 (15.63%) GitHub Actions
6 8 (12.50%) Google Kubernetes Engine
7 6 (9.38%) Amazon CloudWatch
7 6 (9.38%) AWS CloudFormation
7 6 (9.38%) Azure DevOps
8 5 (7.81%) Amazon S3
8 5 (7.81%) Cloud Run
8 5 (7.81%) Virtual Private Cloud
9 4 (6.25%) Amazon EKS
9 4 (6.25%) Slack
9 4 (6.25%) Snowflake
10 3 (4.69%) Amazon ECS
10 3 (4.69%) Apigee
10 3 (4.69%) Azure Key Vault
10 3 (4.69%) Stackdriver
10 3 (4.69%) Vertex AI
Communications & Networking
1 7 (10.94%) Firewall
2 6 (9.38%) DNS
3 4 (6.25%) VPN
4 2 (3.13%) SSL
4 2 (3.13%) TCP/IP
5 1 (1.56%) 3GPP
5 1 (1.56%) 4G
5 1 (1.56%) 5G
5 1 (1.56%) BGP
5 1 (1.56%) DHCP
5 1 (1.56%) IPsec
5 1 (1.56%) MPLS
5 1 (1.56%) Network Security
5 1 (1.56%) OSPF
5 1 (1.56%) Radio Access Network
5 1 (1.56%) SNMP
5 1 (1.56%) SSH
5 1 (1.56%) VLAN
5 1 (1.56%) Wireshark
Database & Business Intelligence
1 7 (10.94%) Elasticsearch
2 6 (9.38%) Relational Database
3 3 (4.69%) MySQL
3 3 (4.69%) Tableau
4 2 (3.13%) DynamoDB
4 2 (3.13%) MongoDB
4 2 (3.13%) PostgreSQL
4 2 (3.13%) Redis
5 1 (1.56%) Amazon Aurora
5 1 (1.56%) Amazon RDS
5 1 (1.56%) Apache Hive
5 1 (1.56%) Big Data
5 1 (1.56%) CouchDB
5 1 (1.56%) Data Warehouse
5 1 (1.56%) Hadoop
5 1 (1.56%) Impala
5 1 (1.56%) KDB
5 1 (1.56%) Kdb+
5 1 (1.56%) Pinecone
5 1 (1.56%) SQL Server
Development Applications
1 19 (29.69%) Jenkins
2 13 (20.31%) Git
2 13 (20.31%) GitLab
3 9 (14.06%) Gradle
4 8 (12.50%) Maven
4 8 (12.50%) SonarQube
5 5 (7.81%) Selenium
6 4 (6.25%) JIRA
7 3 (4.69%) Snyk
7 3 (4.69%) TeamCity
8 2 (3.13%) Atlassian Bamboo
8 2 (3.13%) Cucumber
8 2 (3.13%) Cypress.io
8 2 (3.13%) JUnit
9 1 (1.56%) Ant
9 1 (1.56%) Bitbucket
9 1 (1.56%) Hamcrest
9 1 (1.56%) jMock
9 1 (1.56%) Mockito
9 1 (1.56%) SoapUI
General
1 22 (34.38%) Social Skills
2 21 (32.81%) Finance
3 12 (18.75%) Banking
4 8 (12.50%) Investment Banking
5 4 (6.25%) Financial Institution
5 4 (6.25%) Public Sector
6 3 (4.69%) Analytical Skills
6 3 (4.69%) Telecoms
7 2 (3.13%) Front Office
7 2 (3.13%) Retail Banking
8 1 (1.56%) Inclusion and Diversity
8 1 (1.56%) Pharmaceutical
8 1 (1.56%) Presentation Skills
Job Titles
1 15 (23.44%) Developer
1 15 (23.44%) Senior
2 6 (9.38%) DevOps Engineer
3 5 (7.81%) Architect
3 5 (7.81%) Java Developer
3 5 (7.81%) Python Engineer
4 4 (6.25%) Applications Engineer
4 4 (6.25%) Artificial Intelligence Engineer
4 4 (6.25%) GCP Engineer
4 4 (6.25%) Platform Engineer
4 4 (6.25%) Senior Developer
5 3 (4.69%) Lead
6 2 (3.13%) AWS DevOps
6 2 (3.13%) AWS Engineer
6 2 (3.13%) AWS Specialist
6 2 (3.13%) DevOps Specialist
6 2 (3.13%) Front-End Engineer (Client-Side Engineer)
6 2 (3.13%) Senior DevOps
6 2 (3.13%) Senior DevOps Engineer
6 2 (3.13%) Solutions Architect
Libraries, Frameworks & Software Standards
1 9 (14.06%) RESTful
2 8 (12.50%) CSS
2 8 (12.50%) HTML
3 7 (10.94%) GraphQL
3 7 (10.94%) REST
4 6 (9.38%) Elastic Stack
4 6 (9.38%) FIX Protocol
4 6 (9.38%) Node.js
5 4 (6.25%) Pandas
5 4 (6.25%) React
6 3 (4.69%) .NET
6 3 (4.69%) Flask
6 3 (4.69%) HTML5
6 3 (4.69%) Spring
6 3 (4.69%) Spring Boot
7 2 (3.13%) jQuery
7 2 (3.13%) JSON
7 2 (3.13%) OAuth
7 2 (3.13%) OAuth2
7 2 (3.13%) SOAP
Miscellaneous
1 20 (31.25%) Cloud Native
2 9 (14.06%) Distributed Systems
3 7 (10.94%) Virtual Team
4 6 (9.38%) Fixed Income
4 6 (9.38%) Foreign Exchange (FX)
5 5 (7.81%) Data Centre
6 4 (6.25%) Onboarding
7 3 (4.69%) IVR
8 2 (3.13%) AI Agents
8 2 (3.13%) Algorithms
8 2 (3.13%) Data Structures
8 2 (3.13%) Distributed Applications
8 2 (3.13%) Distributed Architecture
8 2 (3.13%) Enterprise Software
8 2 (3.13%) Greenfield Project
8 2 (3.13%) Hybrid Cloud
8 2 (3.13%) Legacy Systems
8 2 (3.13%) Public Cloud
8 2 (3.13%) Security Posture
9 1 (1.56%) Linux Command Line
Operating Systems
1 14 (21.88%) Linux
2 4 (6.25%) Unix
3 3 (4.69%) Windows
4 1 (1.56%) Windows Server
Processes & Methodologies
1 37 (57.81%) CI/CD
1 37 (57.81%) DevOps
2 34 (53.13%) Containerisation
3 18 (28.13%) Agile
4 17 (26.56%) Infrastructure as Code
5 13 (20.31%) Microservices
5 13 (20.31%) Problem-Solving
6 12 (18.75%) Design Patterns
7 11 (17.19%) Machine Learning
7 11 (17.19%) Observability
7 11 (17.19%) Test Automation
8 10 (15.63%) AI
8 10 (15.63%) Software Engineering
9 9 (14.06%) Event-Driven
10 8 (12.50%) Code Quality
11 7 (10.94%) Event-Driven Architecture
11 7 (10.94%) Project Management
11 7 (10.94%) RBAC
11 7 (10.94%) Scrum
11 7 (10.94%) Site Reliability Engineering
Programming Languages
1 33 (51.56%) Python
2 19 (29.69%) Java
3 10 (15.63%) SQL
4 9 (14.06%) JavaScript
5 7 (10.94%) PowerShell
5 7 (10.94%) TypeScript
6 3 (4.69%) Bash
6 3 (4.69%) Bicep
7 2 (3.13%) C#
7 2 (3.13%) Go
7 2 (3.13%) PHP
7 2 (3.13%) Rust
7 2 (3.13%) Shell Script
8 1 (1.56%) C++
8 1 (1.56%) Kotlin
8 1 (1.56%) PromQL
Qualifications
1 8 (12.50%) SC Cleared
1 8 (12.50%) Security Cleared
2 4 (6.25%) Degree
3 3 (4.69%) AWS Certification
4 2 (3.13%) AWS Certified Developer
4 2 (3.13%) AWS Certified DevOps Engineer
4 2 (3.13%) AWS Certified Solutions Architect
4 2 (3.13%) AWS Certified SysOps Administrator
4 2 (3.13%) Azure Certification
4 2 (3.13%) BPSS Clearance
5 1 (1.56%) AWS Certified Cloud Practitioner
5 1 (1.56%) CISSP
5 1 (1.56%) Computer Science Degree
5 1 (1.56%) DV Cleared
5 1 (1.56%) Master's Degree
5 1 (1.56%) MCP
5 1 (1.56%) PhD
Quality Assurance & Compliance
1 5 (7.81%) GDPR
1 5 (7.81%) ISO/IEC 27001
2 4 (6.25%) QA
3 3 (4.69%) Data Quality
3 3 (4.69%) SOC 2
4 1 (1.56%) Accessibility
4 1 (1.56%) EU AI Act
4 1 (1.56%) MiFID
4 1 (1.56%) NIST
4 1 (1.56%) WCAG
System Software
1 1 (1.56%) HDFS
Systems Management
1 40 (62.50%) Kubernetes
2 26 (40.63%) Terraform
3 11 (17.19%) Ansible
4 7 (10.94%) Kibana
5 6 (9.38%) Argo
5 6 (9.38%) ITRS Geneos
5 6 (9.38%) logstash
5 6 (9.38%) Puppet
6 5 (7.81%) Istio
7 3 (4.69%) Grafana
7 3 (4.69%) Progress Chef
8 2 (3.13%) Prometheus
9 1 (1.56%) Consul
9 1 (1.56%) Kubeflow
9 1 (1.56%) Packer
9 1 (1.56%) Podman
9 1 (1.56%) Single Sign-On
Vendors
1 14 (21.88%) Google
2 6 (9.38%) Microsoft
2 6 (9.38%) Solace
3 4 (6.25%) OpenAI
3 4 (6.25%) Splunk
4 3 (4.69%) Bloomberg
4 3 (4.69%) Cloudera
4 3 (4.69%) MuleSoft
5 2 (3.13%) CheckPoint
5 2 (3.13%) Databricks
5 2 (3.13%) Dynatrace
5 2 (3.13%) F5
5 2 (3.13%) Palo Alto
6 1 (1.56%) AppDynamics
6 1 (1.56%) Atlassian
6 1 (1.56%) Confluent
6 1 (1.56%) Dell
6 1 (1.56%) Oracle
6 1 (1.56%) ServiceNow
6 1 (1.56%) TIBCO