Azure Jobs in the North West

Microsoft Azure
England > North West

The table below provides summary statistics for permanent job vacancies advertised in the North West requiring Azure skills. It includes a benchmarking guide to the annual salaries offered in vacancies that cited Azure over the 6 months leading up to 3 November 2024, comparing them to the same period in the previous two years.

6 months to
3 Nov 2024
Same period 2023 Same period 2022
Rank 9 3 2
Rank change year-on-year -6 -1 +2
Permanent jobs citing Azure 932 1,061 2,345
As % of all permanent jobs advertised in the North West 11.16% 23.98% 25.86%
As % of the Cloud Services category 46.07% 54.97% 55.77%
Number of salaries quoted 556 718 1,240
10th Percentile £38,750 £37,275 £32,500
25th Percentile £46,250 £43,750 £42,500
Median annual salary (50th Percentile) £55,000 £57,581 £55,000
Median % change year-on-year -4.48% +4.69% -
75th Percentile £71,563 £75,000 £71,938
90th Percentile £83,875 £86,250 £82,500
England median annual salary £65,000 £62,500 £65,000
% change year-on-year +4.00% -3.85% +8.33%

All Cloud Skills
North West

Azure falls under the Cloud Services category. For comparison with the information above, the following table provides summary statistics for all permanent job vacancies requiring cloud computing skills in the North West.

Permanent vacancies with a requirement for cloud computing skills 2,023 1,930 4,205
As % of all permanent jobs advertised in the North West 24.23% 43.62% 46.37%
Number of salaries quoted 1,111 1,432 2,607
10th Percentile £32,500 £30,500 £30,000
25th Percentile £42,500 £41,250 £41,250
Median annual salary (50th Percentile) £55,000 £57,500 £55,000
Median % change year-on-year -4.35% +4.55% +4.76%
75th Percentile £68,750 £72,500 £72,125
90th Percentile £82,500 £85,000 £85,000
England median annual salary £65,000 £62,500 £65,000
% change year-on-year +4.00% -3.85% +8.33%

Azure
Job Vacancy Trend in the North West

Job postings citing Azure as a proportion of all IT jobs advertised in the North West.
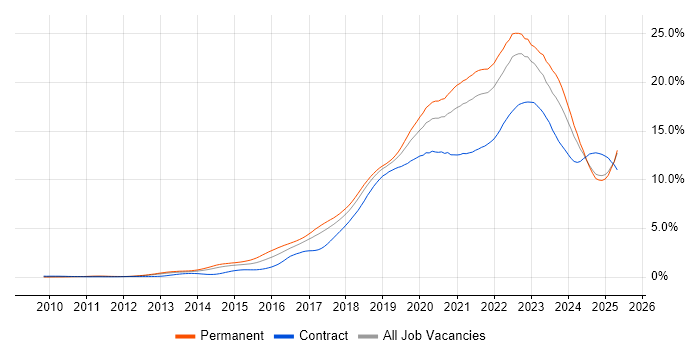
Job vacancy trend for Azure in the North West

Azure
Salary Trend in the North West

3-month moving average salary quoted in jobs citing Azure in the North West.

Salary trend for Azure in the North West

Azure
Salary Histogram in the North West

Salary distribution for jobs citing Azure in the North West over the 6 months to 3 November 2024.

Salary histogram for Azure in the North West

Azure
Job Locations in the North West

The table below looks at the demand and provides a guide to the median salaries quoted in IT jobs citing Azure within the North West region over the 6 months to 3 November 2024. The 'Rank Change' column provides an indication of the change in demand within each location based on the same 6 month period last year.

Location Rank Change
on Same Period
Last Year
Matching
Permanent
IT Job Ads
Median Salary
Past 6 Months
Median Salary
% Change
on Same Period
Last Year
Live
Jobs
Manchester -4 582 £60,000 -1.64% 115
Cheshire +1 138 £50,000 - 34
Merseyside -3 95 £61,250 +6.52% 20
Lancashire -28 95 £52,500 +11.70% 26
Cumbria -48 22 £57,500 +71.64% 9
Azure
England

Azure
Co-occurring Skills and Capabilities in the North West by Category

The follow tables expand on the table above by listing co-occurrences grouped by category. The same employment type, locality and period is covered with up to 20 co-occurrences shown in each of the following categories:

Application Platforms
1 55 (5.90%) Microsoft Exchange
2 44 (4.72%) SharePoint
3 26 (2.79%) IIS
4 18 (1.93%) Confluence
5 14 (1.50%) Apache
6 10 (1.07%) Apache Spark
7 5 (0.54%) BizTalk Server
8 4 (0.43%) WebSphere
8 4 (0.43%) WebSphere Application Server
9 3 (0.32%) Apache Solr
9 3 (0.32%) CMS
9 3 (0.32%) NServiceBus
10 2 (0.21%) OpenStack
10 2 (0.21%) Oracle SOA Suite
11 1 (0.11%) Apache Airflow
11 1 (0.11%) SAS
11 1 (0.11%) Umbraco
Applications
1 20 (2.15%) Microsoft Office
2 15 (1.61%) Microsoft Excel
3 4 (0.43%) Microsoft PowerPoint
4 2 (0.21%) MS Visio
Business Applications
1 17 (1.82%) Dynamics CRM
2 3 (0.32%) Infor CloudSuite Industrial (formerly SyteLine)
2 3 (0.32%) Sage 200
3 2 (0.21%) SAP Business One
3 2 (0.21%) Temenos T24
4 1 (0.11%) NEC Housing
Cloud Services
1 273 (29.29%) AWS
2 146 (15.67%) Microsoft 365
3 115 (12.34%) Azure DevOps
4 106 (11.37%) GCP
5 105 (11.27%) Power Platform
6 63 (6.76%) Entra ID
7 56 (6.01%) SaaS
8 50 (5.36%) Azure Data Factory
9 33 (3.54%) Cloud Computing
10 27 (2.90%) Dynamics 365
11 26 (2.79%) GitHub
11 26 (2.79%) PaaS
12 23 (2.47%) Azure Synapse Analytics
12 23 (2.47%) PowerApps
12 23 (2.47%) Serverless
13 21 (2.25%) Azure AKS
13 21 (2.25%) Azure Logic Apps
14 20 (2.15%) AWS CloudFormation
15 19 (2.04%) Power Automate
16 18 (1.93%) Azure Sentinel
Communications & Networking
1 71 (7.62%) DNS
2 59 (6.33%) DHCP
3 49 (5.26%) Firewall
4 48 (5.15%) WAN
5 45 (4.83%) LAN
6 42 (4.51%) Internet
7 41 (4.40%) TCP/IP
8 31 (3.33%) VPN
9 23 (2.47%) MPLS
9 23 (2.47%) Network Security
10 22 (2.36%) Wireless
11 21 (2.25%) Intrusion Detection
12 19 (2.04%) SSL
13 16 (1.72%) VLAN
14 15 (1.61%) BGP
15 13 (1.39%) OSPF
16 9 (0.97%) VoIP
17 5 (0.54%) NetScaler
17 5 (0.54%) WLAN
18 4 (0.43%) F5 BIG-IP LTM
Database & Business Intelligence
1 98 (10.52%) SQL Server
2 75 (8.05%) Power BI
3 57 (6.12%) Data Warehouse
4 48 (5.15%) Azure SQL Database
5 45 (4.83%) Data Lake
6 28 (3.00%) NoSQL
7 26 (2.79%) SQL Server Integration Services
8 25 (2.68%) MongoDB
9 18 (1.93%) PostgreSQL
10 16 (1.72%) Azure SQL Data Warehouse
11 15 (1.61%) Data Vault
11 15 (1.61%) SQL Server Reporting Services
12 14 (1.50%) Geospatial Data
12 14 (1.50%) MySQL
12 14 (1.50%) Tableau
13 13 (1.39%) Big Data
13 13 (1.39%) Elasticsearch
14 8 (0.86%) OLTP
14 8 (0.86%) Relational Database
15 7 (0.75%) Amazon RDS
Development Applications
1 37 (3.97%) JIRA
2 31 (3.33%) Jenkins
3 30 (3.22%) Git
4 22 (2.36%) GitLab
5 10 (1.07%) Postman
5 10 (1.07%) Visual Studio
6 9 (0.97%) Cypress.io
6 9 (0.97%) Selenium
6 9 (0.97%) TeamCity
7 7 (0.75%) Octopus Deploy
8 6 (0.64%) Team Foundation Server
9 5 (0.54%) Artifactory
9 5 (0.54%) Bitbucket
10 4 (0.43%) Babel
10 4 (0.43%) Fiddler
10 4 (0.43%) SpecFlow
10 4 (0.43%) webpack
11 3 (0.32%) JMeter
11 3 (0.32%) NUnit
11 3 (0.32%) SonarQube
General
1 200 (21.46%) Social Skills
2 107 (11.48%) Finance
3 80 (8.58%) Analytical Skills
4 38 (4.08%) Public Sector
5 28 (3.00%) Law
6 25 (2.68%) Retail
7 22 (2.36%) Marketing
8 21 (2.25%) Inclusion and Diversity
9 19 (2.04%) Manufacturing
10 16 (1.72%) Presentation Skills
11 15 (1.61%) Organisational Skills
12 14 (1.50%) Legal
13 12 (1.29%) Advertising
14 11 (1.18%) Automotive
15 10 (1.07%) Banking
16 9 (0.97%) Games
17 6 (0.64%) Tech for Good
18 5 (0.54%) Back Office
18 5 (0.54%) Electronics
18 5 (0.54%) Telecoms
Job Titles
1 219 (23.50%) Developer
2 143 (15.34%) Senior
3 117 (12.55%) Lead
4 95 (10.19%) .NET Developer
5 94 (10.09%) Architect
6 76 (8.15%) Software Engineer
7 75 (8.05%) Analyst
8 64 (6.87%) Azure Engineer
9 55 (5.90%) Data Engineer
10 46 (4.94%) Senior Developer
11 45 (4.83%) Cloud Engineer
11 45 (4.83%) Infrastructure Engineer
12 34 (3.65%) Software Developer
13 32 (3.43%) IT Engineer
14 31 (3.33%) Consultant
14 31 (3.33%) Solutions Architect
15 30 (3.22%) Data Architect
16 27 (2.90%) Senior .NET Developer
17 25 (2.68%) Senior Software Engineer
17 25 (2.68%) Support Engineer
Libraries, Frameworks & Software Standards
1 230 (24.68%) .NET
2 84 (9.01%) React
3 83 (8.91%) .NET Core
4 67 (7.19%) .NET Framework
5 56 (6.01%) ASP.NET
6 47 (5.04%) AngularJS
7 40 (4.29%) REST
8 35 (3.76%) HTML
9 34 (3.65%) CSS
9 34 (3.65%) Entity Framework
10 33 (3.54%) ASP.NET Web API
11 31 (3.33%) Node.js
12 24 (2.58%) RESTful
13 19 (2.04%) Vue
14 17 (1.82%) HTML5
15 14 (1.50%) Web Services
16 13 (1.39%) PySpark
16 13 (1.39%) RabbitMQ
17 12 (1.29%) CSS3
17 12 (1.29%) SOAP
Miscellaneous
1 34 (3.65%) Self-Motivation
2 28 (3.00%) Greenfield Project
3 23 (2.47%) Cyber Threat
3 23 (2.47%) Distributed Systems
4 22 (2.36%) Product Ownership
5 21 (2.25%) Data Centre
6 20 (2.15%) Data Structures
7 19 (2.04%) Legacy Systems
8 17 (1.82%) Cloud Native
8 17 (1.82%) Public Cloud
9 16 (1.72%) Mobile App
9 16 (1.72%) Security Operations Centre
10 14 (1.50%) IoT
10 14 (1.50%) Onboarding
11 13 (1.39%) Media Streaming
12 11 (1.18%) Driving Licence
12 11 (1.18%) Private Cloud
12 11 (1.18%) Reinsurance
12 11 (1.18%) Virtual Team
13 10 (1.07%) Hybrid Cloud
Operating Systems
1 173 (18.56%) Windows
2 83 (8.91%) Windows Server
3 64 (6.87%) Linux
4 27 (2.90%) Windows 10
5 12 (1.29%) Android
5 12 (1.29%) Unix
6 10 (1.07%) Apple iOS
7 9 (0.97%) Windows Server 2019
8 6 (0.64%) VMS
8 6 (0.64%) Windows Server 2016
9 5 (0.54%) Mac OS
10 2 (0.21%) CentOS
10 2 (0.21%) Debian
10 2 (0.21%) Mac OS X
10 2 (0.21%) Ubuntu
10 2 (0.21%) Windows Server 2012
Processes & Methodologies
1 287 (30.79%) DevOps
2 267 (28.65%) Agile
3 135 (14.48%) Problem-Solving
4 134 (14.38%) Software Engineering
5 126 (13.52%) CI/CD
6 99 (10.62%) Mentoring
7 98 (10.52%) Microservices
8 91 (9.76%) Roadmaps
9 82 (8.80%) Business Intelligence
10 81 (8.69%) Migration
11 79 (8.48%) ITIL
12 78 (8.37%) Infrastructure as Code
12 78 (8.37%) Infrastructure Engineering
13 77 (8.26%) Full-Stack Development
14 75 (8.05%) Continuous Improvement
15 71 (7.62%) Cybersecurity
16 70 (7.51%) Scrum
17 63 (6.76%) Data Modelling
17 63 (6.76%) ETL
18 61 (6.55%) Computer Science
Programming Languages
1 218 (23.39%) SQL
2 173 (18.56%) C#
3 148 (15.88%) Python
4 89 (9.55%) PowerShell
5 81 (8.69%) JavaScript
6 63 (6.76%) Java
7 58 (6.22%) TypeScript
8 26 (2.79%) T-SQL
9 22 (2.36%) C++
10 19 (2.04%) Bash
11 16 (1.72%) Go
11 16 (1.72%) Scala
12 15 (1.61%) Bicep
13 14 (1.50%) Kotlin
14 12 (1.29%) PHP
15 11 (1.18%) Perl
15 11 (1.18%) Ruby
16 10 (1.07%) VB.NET
17 9 (0.97%) Data Analysis Expressions
18 8 (0.86%) R
Qualifications
1 117 (12.55%) Degree
2 73 (7.83%) Security Cleared
3 41 (4.40%) Azure Certification
4 35 (3.76%) SC Cleared
5 29 (3.11%) Cisco Certification
5 29 (3.11%) Computer Science Degree
6 19 (2.04%) CISSP
6 19 (2.04%) DV Cleared
7 18 (1.93%) Microsoft Certification
8 13 (1.39%) CCNP
9 12 (1.29%) AWS Certification
9 12 (1.29%) CCNA
10 11 (1.18%) Master's Degree
11 10 (1.07%) CISM
12 9 (0.97%) CEH
12 9 (0.97%) JNCIS
13 8 (0.86%) TOGAF Certification
14 6 (0.64%) CISA
14 6 (0.64%) CRISC
14 6 (0.64%) GSLC
Quality Assurance & Compliance
1 36 (3.86%) Data Quality
2 28 (3.00%) QA
3 24 (2.58%) SLA
4 20 (2.15%) NIST
5 16 (1.72%) ISO/IEC 27001
6 15 (1.61%) Cyber Essentials
6 15 (1.61%) GDPR
7 5 (0.54%) PCI DSS
8 4 (0.43%) Accessibility
8 4 (0.43%) NCSC
9 2 (0.21%) COBIT
10 1 (0.11%) Actionable Recommendations
10 1 (0.11%) IEC 62304
10 1 (0.11%) ISO 20022
10 1 (0.11%) ISO/IEC 27002 (supersedes ISO/IEC 17799)
10 1 (0.11%) SEPA
10 1 (0.11%) TARGET2
System Software
1 134 (14.38%) Active Directory
2 78 (8.37%) Docker
3 49 (5.26%) Hyper-V
4 38 (4.08%) VMware Infrastructure
5 29 (3.11%) Virtual Machines
6 16 (1.72%) vSphere
7 8 (0.86%) VMware ESXi
8 3 (0.32%) Virtual Desktop
8 3 (0.32%) Virtual Servers
9 2 (0.21%) Firmware
9 2 (0.21%) VMware Server
10 1 (0.11%) Embedded Firmware
10 1 (0.11%) Shibboleth
10 1 (0.11%) VMware NSX
10 1 (0.11%) XenApp
10 1 (0.11%) XenDesktop
Systems Management
1 99 (10.62%) Terraform
2 82 (8.80%) Kubernetes
3 73 (7.83%) Microsoft Intune
4 59 (6.33%) Ansible
5 20 (2.15%) Puppet
6 16 (1.72%) Grafana
6 16 (1.72%) SCCM
7 14 (1.50%) Prometheus
8 8 (0.86%) Single Sign-On
9 7 (0.75%) Jamf Pro
9 7 (0.75%) Progress Chef
10 6 (0.64%) vCenter Server
11 5 (0.54%) Argo
11 5 (0.54%) FortiGate
12 4 (0.43%) CA Single Sign-On
12 4 (0.43%) CSIRT
12 4 (0.43%) IBM BigFix
13 3 (0.32%) Active Directory Federation Services
14 2 (0.21%) Nagios
14 2 (0.21%) Nessus
Vendors
1 323 (34.66%) Microsoft
2 95 (10.19%) VMware
3 48 (5.15%) Google
4 46 (4.94%) Databricks
5 37 (3.97%) Citrix
6 25 (2.68%) Informatica
7 24 (2.58%) Cisco
8 21 (2.25%) Oracle
9 17 (1.82%) ServiceNow
9 17 (1.82%) Veeam
10 8 (0.86%) Apple
10 8 (0.86%) BT
10 8 (0.86%) CheckPoint
10 8 (0.86%) Salesforce
11 7 (0.75%) SAP
12 6 (0.64%) IBM
12 6 (0.64%) Meraki
12 6 (0.64%) Openreach
12 6 (0.64%) webMethods
13 5 (0.54%) CyberArk