Azure Contracts in the North West

Microsoft Azure
England > North West

The table below provides summary statistics for contract job vacancies advertised in the North West requiring Azure skills. It includes a benchmarking guide to the contractor rates offered in vacancies that cited Azure over the 6 months leading up to 9 May 2025, comparing them to the same period in the previous two years.

6 months to
9 May 2025
Same period 2024 Same period 2023
Rank 8 12 4
Rank change year-on-year +4 -8 0
Contract jobs citing Azure 252 281 561
As % of all contract jobs advertised in the North West 12.91% 10.49% 18.07%
As % of the Cloud Services category 40.19% 32.87% 48.15%
Number of daily rates quoted 194 218 426
10th Percentile £254 £334 £354
25th Percentile £400 £413 £425
Median daily rate (50th Percentile) £496 £492 £500
Median % change year-on-year +0.76% -1.55% -
75th Percentile £575 £582 £575
90th Percentile £671 £650 £650
England median daily rate £525 £545 £560
% change year-on-year -3.67% -2.68% +1.82%
Number of hourly rates quoted 2 2 12
10th Percentile £67.63 £16.40 £16.40
25th Percentile £67.81 £16.63 £19.44
Median hourly rate £71.25 £18.00 £67.75
Median % change year-on-year +295.83% -73.43% +201.11%
75th Percentile £75.31 £19.13 £70.00
90th Percentile £75.88 £19.20 -
England median hourly rate £38.75 £35.00 £58.65
% change year-on-year +10.71% -40.32% +21.50%

All Cloud Skills
North West

Azure falls under the Cloud Services category. For comparison with the information above, the following table provides summary statistics for all contract job vacancies requiring cloud computing skills in the North West.

Contract vacancies with a requirement for cloud computing skills 627 855 1,165
As % of all contract IT jobs advertised in the North West 32.12% 31.90% 37.52%
Number of daily rates quoted 485 618 861
10th Percentile £238 £284 £313
25th Percentile £393 £388 £413
Median daily rate (50th Percentile) £475 £480 £500
Median % change year-on-year -1.04% -4.00% -
75th Percentile £550 £575 £575
90th Percentile £638 £638 £655
England median daily rate £525 £525 £550
% change year-on-year - -4.55% -
Number of hourly rates quoted 12 65 32
10th Percentile £14.23 £13.00 £16.19
25th Percentile £26.88 - £18.31
Median hourly rate £28.75 £16.06 £37.30
Median % change year-on-year +79.02% -56.94% +97.96%
75th Percentile £50.66 £26.50 £65.00
90th Percentile £75.88 £60.40 £70.00
England median hourly rate £25.50 £21.00 £32.30
% change year-on-year +21.43% -34.98% +50.93%

Azure
Job Vacancy Trend in the North West

Job postings citing Azure as a proportion of all IT jobs advertised in the North West.
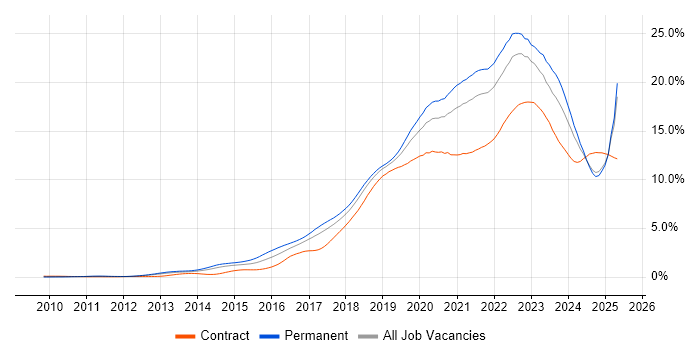
Job vacancy trend for Azure in the North West

Azure
Contractor Daily Rate Trend in the North West

3-month moving average daily rate quoted in jobs citing Azure in the North West.

Daily rate trend for Azure in the North West

Azure
Daily Rate Histogram in the North West

Daily rate distribution for jobs citing Azure in the North West over the 6 months to 9 May 2025.

Daily rate histogram for Azure in the North West

Azure
Contractor Hourly Rate Trend in the North West

3-month moving average hourly rates quoted in jobs citing Azure in the North West.

Hourly rate trend for Azure in the North West

Azure
Contract Job Locations in the North West

The table below looks at the demand and provides a guide to the median contractor rates quoted in IT jobs citing Azure within the North West region over the 6 months to 9 May 2025. The 'Rank Change' column provides an indication of the change in demand within each location based on the same 6 month period last year.

Location Rank Change
on Same Period
Last Year
Matching
Contract
IT Job Ads
Median
Daily Rate
Past 6 Months
Median Daily Rate
% Change
on Same Period
Last Year
Live
Jobs
Manchester +1 147 £510 +2.00% 396
Cheshire 0 53 £425 -11.83% 88
Merseyside +6 16 £400 -3.03% 46
Cumbria +15 15 £525 +0.67% 10
Lancashire -2 13 £475 -26.92% 160
Azure
England

Azure
Co-occurring Skills and Capabilities in the North West by Category

The follow tables expand on the table above by listing co-occurrences grouped by category. The same employment type, locality and period is covered with up to 20 co-occurrences shown in each of the following categories:

Application Platforms
1 51 (20.24%) Microsoft Exchange
2 45 (17.86%) SharePoint
3 7 (2.78%) Apache Spark
4 5 (1.98%) Confluence
5 4 (1.59%) Apache
5 4 (1.59%) Camunda
5 4 (1.59%) SAS
6 3 (1.19%) CMS
6 3 (1.19%) WebSphere
7 2 (0.79%) Apache Airflow
7 2 (0.79%) BizTalk Server
7 2 (0.79%) WebSphere Application Server
8 1 (0.40%) Adobe Experience Manager
8 1 (0.40%) JBoss
8 1 (0.40%) Liferay
8 1 (0.40%) SharePoint Server
8 1 (0.40%) Sitecore CMS
8 1 (0.40%) Tomcat
8 1 (0.40%) Umbraco
Applications
1 16 (6.35%) Microsoft Office
2 5 (1.98%) Microsoft Excel
3 1 (0.40%) Chatbot
Business Applications
1 7 (2.78%) Dynamics CRM
2 6 (2.38%) SAP S/4HANA
3 5 (1.98%) Kondor
4 2 (0.79%) Unit4 Business World
5 1 (0.40%) NetSuite
5 1 (0.40%) Remedy ITSM
5 1 (0.40%) Shopify
Cloud Services
1 75 (29.76%) Microsoft 365
2 69 (27.38%) Entra ID
3 53 (21.03%) AWS
4 42 (16.67%) GCP
5 30 (11.90%) Power Platform
6 22 (8.73%) Azure DevOps
7 18 (7.14%) Azure Data Factory
8 16 (6.35%) IaaS
8 16 (6.35%) SaaS
9 15 (5.95%) OneDrive
10 11 (4.37%) Dynamics 365
11 8 (3.17%) PowerApps
11 8 (3.17%) Serverless
11 8 (3.17%) Snowflake
12 7 (2.78%) Microsoft Purview
13 6 (2.38%) Azure Cosmos DB
13 6 (2.38%) Cloud Computing
14 5 (1.98%) Azure AKS
14 5 (1.98%) Azure Synapse Analytics
14 5 (1.98%) Power Automate
Communications & Networking
1 27 (10.71%) Firewall
2 15 (5.95%) DNS
2 15 (5.95%) Network Security
3 14 (5.56%) DHCP
4 11 (4.37%) Intrusion Detection
5 9 (3.57%) VPN
6 7 (2.78%) WAN
7 6 (2.38%) SAN
8 5 (1.98%) Wireless
9 4 (1.59%) LAN
9 4 (1.59%) Wi-Fi
10 3 (1.19%) BGP
10 3 (1.19%) Internet
10 3 (1.19%) iSCSI
10 3 (1.19%) OSPF
10 3 (1.19%) Remote Desktop
10 3 (1.19%) SD-WAN
10 3 (1.19%) TCP/IP
11 2 (0.79%) Calico
11 2 (0.79%) NAS
Database & Business Intelligence
1 33 (13.10%) SQL Server
2 27 (10.71%) Power BI
3 16 (6.35%) Data Warehouse
4 12 (4.76%) Data Lake
5 11 (4.37%) PostgreSQL
6 10 (3.97%) NoSQL
6 10 (3.97%) Relational Database
7 9 (3.57%) Azure SQL Database
8 6 (2.38%) Delta Lake
8 6 (2.38%) MongoDB
8 6 (2.38%) MySQL
8 6 (2.38%) SQL Server Integration Services
8 6 (2.38%) Tableau
9 5 (1.98%) Big Data
10 4 (1.59%) Metadata
10 4 (1.59%) Neo4j
11 3 (1.19%) Amazon Redshift
11 3 (1.19%) Bigtable
11 3 (1.19%) Data Vault
11 3 (1.19%) Dremio
Development Applications
1 15 (5.95%) Git
2 8 (3.17%) JIRA
3 7 (2.78%) ERwin
4 5 (1.98%) Babel
4 5 (1.98%) GitLab
4 5 (1.98%) Jenkins
4 5 (1.98%) Visual Studio
4 5 (1.98%) webpack
5 3 (1.19%) ER Studio
5 3 (1.19%) Maven
5 3 (1.19%) SQL Server Management Studio (SSMS)
6 2 (0.79%) Hudson
6 2 (0.79%) Postman
6 2 (0.79%) Selenium
7 1 (0.40%) Cucumber
7 1 (0.40%) Flyway
7 1 (0.40%) Liquibase
7 1 (0.40%) SonarQube
7 1 (0.40%) Visual Studio Code
7 1 (0.40%) WebDriver
General
1 62 (24.60%) Social Skills
2 40 (15.87%) Finance
3 34 (13.49%) Public Sector
4 26 (10.32%) Analytical Skills
5 19 (7.54%) Legal
6 18 (7.14%) Telecoms
7 16 (6.35%) Banking
8 11 (4.37%) Manufacturing
8 11 (4.37%) Retail
9 8 (3.17%) Pharmaceutical
10 7 (2.78%) Military
11 3 (1.19%) Marketing
12 2 (0.79%) Inclusion and Diversity
12 2 (0.79%) Organisational Skills
13 1 (0.40%) Advertising
13 1 (0.40%) Aviation
13 1 (0.40%) Billing
13 1 (0.40%) Documentation Skills
13 1 (0.40%) Influencing Skills
13 1 (0.40%) Publishing
Job Titles
1 37 (14.68%) Architect
2 33 (13.10%) Developer
3 22 (8.73%) Microsoft 365 Engineer
4 19 (7.54%) Senior
4 19 (7.54%) Support Engineer
5 18 (7.14%) Data Engineer
6 15 (5.95%) Analyst
6 15 (5.95%) Solutions Architect
7 12 (4.76%) Infrastructure Engineer
8 11 (4.37%) Azure Engineer
9 9 (3.57%) DevOps Engineer
10 8 (3.17%) Azure Architect
10 8 (3.17%) Full-Stack Developer
10 8 (3.17%) IT Engineer
11 7 (2.78%) Azure Developer
12 6 (2.38%) Front-End Developer (Client-Side Developer)
12 6 (2.38%) Full-Stack Java Developer
12 6 (2.38%) Infrastructure Specialist
12 6 (2.38%) Java Developer
12 6 (2.38%) Node.js Developer
Libraries, Frameworks & Software Standards
1 19 (7.54%) .NET
2 14 (5.56%) REST
3 12 (4.76%) Node.js
4 9 (3.57%) RESTful
5 8 (3.17%) React
6 7 (2.78%) CSS
6 7 (2.78%) HTML
6 7 (2.78%) SOAP
7 6 (2.38%) ADO
7 6 (2.38%) HTML5
7 6 (2.38%) PySpark
7 6 (2.38%) TensorFlow
8 5 (1.98%) ARM Templates
8 5 (1.98%) Kafka
8 5 (1.98%) PyTorch
9 4 (1.59%) ASP.NET
9 4 (1.59%) Express.js
9 4 (1.59%) FastAPI
10 3 (1.19%) .NET Core
10 3 (1.19%) Next.js
Miscellaneous
1 10 (3.97%) Hybrid Cloud
2 6 (2.38%) Data Centre
2 6 (2.38%) Data Structures
2 6 (2.38%) Onboarding
3 5 (1.98%) Cloud Native
3 5 (1.98%) Derivative
3 5 (1.98%) Foreign Exchange (FX)
3 5 (1.98%) Management Information System
4 4 (1.59%) Algorithms
4 4 (1.59%) IVR
4 4 (1.59%) Life Science
4 4 (1.59%) Mobile App
5 3 (1.19%) Clustering
5 3 (1.19%) Enterprise Software
5 3 (1.19%) IoT
6 2 (0.79%) Analytical Mindset
6 2 (0.79%) Cyber Threat
6 2 (0.79%) Driving Licence
6 2 (0.79%) Enterprise Cloud
6 2 (0.79%) Product Ownership
Operating Systems
1 58 (23.02%) Windows
2 41 (16.27%) Windows Server
3 25 (9.92%) Linux
4 12 (4.76%) VMS
5 11 (4.37%) Unix
5 11 (4.37%) Windows 10
6 8 (3.17%) Windows Server 2016
7 6 (2.38%) Android
7 6 (2.38%) Windows Server 2019
8 4 (1.59%) Apple iOS
8 4 (1.59%) Windows Server 2012
9 2 (0.79%) AIX
9 2 (0.79%) CentOS
9 2 (0.79%) HPUX
9 2 (0.79%) Red Hat Enterprise Linux
9 2 (0.79%) Solaris
9 2 (0.79%) Ubuntu
10 1 (0.40%) Mac OS
10 1 (0.40%) Windows 7
Processes & Methodologies
1 66 (26.19%) Problem-Solving
2 60 (23.81%) Agile
3 52 (20.63%) DevOps
4 32 (12.70%) CI/CD
5 28 (11.11%) Analytics
5 28 (11.11%) Data Modelling
6 26 (10.32%) Infrastructure Engineering
6 26 (10.32%) ITIL
7 25 (9.92%) ETL
7 25 (9.92%) Migration
8 21 (8.33%) Business Intelligence
8 21 (8.33%) Data Pipeline
8 21 (8.33%) High Availability
8 21 (8.33%) ITSM
9 20 (7.94%) Disaster Recovery
10 19 (7.54%) Microservices
11 18 (7.14%) Collaborative Working
11 18 (7.14%) Project Delivery
12 17 (6.75%) Cybersecurity
12 17 (6.75%) Information Security
Programming Languages
1 48 (19.05%) Python
2 45 (17.86%) SQL
3 31 (12.30%) PowerShell
4 14 (5.56%) C#
5 13 (5.16%) Java
6 11 (4.37%) JavaScript
7 8 (3.17%) Bash
8 5 (1.98%) T-SQL
9 4 (1.59%) Bicep
9 4 (1.59%) Shell Script
10 3 (1.19%) Perl
10 3 (1.19%) Scala
10 3 (1.19%) TypeScript
11 2 (0.79%) R
12 1 (0.40%) Apex Code
12 1 (0.40%) Data Analysis Expressions
12 1 (0.40%) Go
12 1 (0.40%) Ruby
12 1 (0.40%) VB
12 1 (0.40%) VBScript
Qualifications
1 49 (19.44%) Security Cleared
2 38 (15.08%) SC Cleared
3 32 (12.70%) Microsoft Certification
4 28 (11.11%) Degree
5 22 (8.73%) Azure Certification
6 12 (4.76%) Computer Science Degree
7 8 (3.17%) Master's Degree
8 7 (2.78%) AWS Certification
8 7 (2.78%) AWS Certified Solutions Architect
9 5 (1.98%) DBS Check
9 5 (1.98%) MCSE
10 4 (1.59%) VMware Certified Professional (VCP)
11 3 (1.19%) CCIE
11 3 (1.19%) CCNP
11 3 (1.19%) Cisco Certification
11 3 (1.19%) ITIL Foundation Certificate
12 2 (0.79%) CREST Certified
12 2 (0.79%) JNCIE
12 2 (0.79%) OSCE
13 1 (0.40%) BPSS Clearance
Quality Assurance & Compliance
1 16 (6.35%) Data Quality
2 12 (4.76%) QA
3 9 (3.57%) GDPR
4 5 (1.98%) Accessibility
4 5 (1.98%) Basel III
4 5 (1.98%) California Consumer Privacy Act
4 5 (1.98%) MiFID
5 4 (1.59%) PMO
6 3 (1.19%) SLA
7 2 (0.79%) PCI DSS
8 1 (0.40%) COBIT
8 1 (0.40%) NCSC
8 1 (0.40%) NIST
System Software
1 68 (26.98%) Active Directory
2 24 (9.52%) Docker
3 23 (9.13%) VMware Infrastructure
4 12 (4.76%) vSphere
5 5 (1.98%) BitLocker
5 5 (1.98%) Virtual Machines
6 4 (1.59%) Virtual Servers
6 4 (1.59%) VMware ESXi
7 3 (1.19%) Microsoft Virtual Server
7 3 (1.19%) Virtual Desktop
8 2 (0.79%) KVM
9 1 (0.40%) Hyper-V
9 1 (0.40%) Microsoft App-V
Systems Management
1 44 (17.46%) Microsoft Intune
2 30 (11.90%) Kubernetes
3 19 (7.54%) Single Sign-On
3 19 (7.54%) Terraform
4 14 (5.56%) WSUS
5 9 (3.57%) Ansible
6 5 (1.98%) Grafana
6 5 (1.98%) Puppet
7 4 (1.59%) Progress Chef
7 4 (1.59%) Prometheus
7 4 (1.59%) vCenter Server
8 3 (1.19%) Active Directory Federation Services
8 3 (1.19%) SCCM
9 2 (0.79%) Istio
9 2 (0.79%) ZABBIX
10 1 (0.40%) Docker Swarm
10 1 (0.40%) FortiGate
10 1 (0.40%) Graylog
10 1 (0.40%) Jamf Pro
10 1 (0.40%) SCOM
Vendors
1 128 (50.79%) Microsoft
2 35 (13.89%) VMware
3 29 (11.51%) Databricks
4 14 (5.56%) Google
5 11 (4.37%) Citrix
6 9 (3.57%) Oracle
6 9 (3.57%) Virgin Media
7 8 (3.17%) Cisco
8 7 (2.78%) SAP
9 5 (1.98%) Ariba
9 5 (1.98%) CyberArk
9 5 (1.98%) Sybase
9 5 (1.98%) Zscaler
10 4 (1.59%) Apple
10 4 (1.59%) CheckPoint
10 4 (1.59%) Informatica
10 4 (1.59%) Talend
11 3 (1.19%) IBM
11 3 (1.19%) IDERA
11 3 (1.19%) Red Hat