Presentation Skills Job Trends in Birmingham

Presentation Skills
West Midlands > Birmingham

The table below looks at the prevalence of the term Presentation Skills in permanent job vacancies in Birmingham. Included is a benchmarking guide to the salaries offered in vacancies that cited Presentation Skills over the 6 months leading up to 21 October 2025, comparing them to the same period in the previous two years.

6 months to
21 Oct 2025
Same period 2024 Same period 2023
Rank 76 96 63
Rank change year-on-year +20 -33 +32
Permanent jobs citing Presentation Skills 19 31 49
As % of all permanent jobs in Birmingham 1.59% 1.42% 3.81%
As % of the General category 2.59% 2.44% 5.90%
Number of salaries quoted 11 7 41
10th Percentile - £47,300 £36,250
25th Percentile £46,250 £52,750 £46,250
Median annual salary (50th Percentile) £60,000 £60,000 £62,500
Median % change year-on-year - -4.00% -3.85%
75th Percentile £78,438 £81,250 £67,500
90th Percentile £84,375 £117,000 £68,750
West Midlands median annual salary £62,500 £52,500 £57,500
% change year-on-year +19.05% -8.70% +17.35%

All General Skills
Birmingham

Presentation Skills falls under the General Skills category. For comparison with the information above, the following table provides summary statistics for all permanent job vacancies requiring common skills in Birmingham.

Permanent vacancies with a requirement for common skills 734 1,269 830
As % of all permanent jobs advertised in Birmingham 61.53% 58.13% 64.54%
Number of salaries quoted 472 550 701
10th Percentile £31,750 £32,500 £31,250
25th Percentile £41,250 £42,500 £41,250
Median annual salary (50th Percentile) £57,434 £57,500 £55,000
Median % change year-on-year -0.11% +4.55% -
75th Percentile £73,750 £72,500 £68,750
90th Percentile £83,750 £90,000 £80,000
West Midlands median annual salary £47,500 £52,500 £50,000
% change year-on-year -9.52% +5.00% -

Presentation Skills
Job Vacancy Trend in Birmingham

Historical trend showing the proportion of permanent IT job postings citing Presentation Skills relative to all permanent IT jobs advertised in Birmingham.
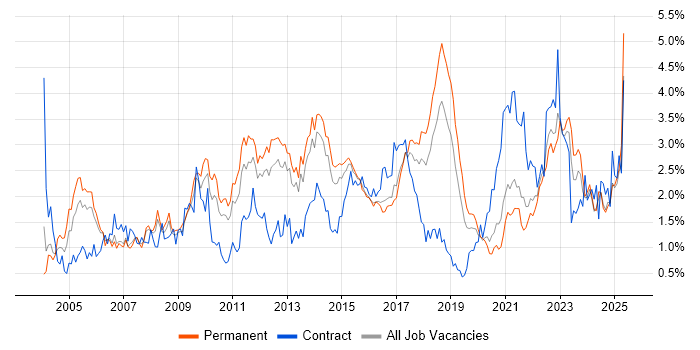
Presentation Skills job vacancy trend in Birmingham

Presentation Skills
Salary Trend in Birmingham

Salary distribution trend for jobs in Birmingham citing Presentation Skills.

Salary distribution trend for jobs in Birmingham citing Presentation Skills

Presentation Skills
Salary Histogram in Birmingham

Salary distribution for jobs citing Presentation Skills in Birmingham over the 6 months to 21 October 2025.

Salary histogram for Presentation Skills in Birmingham

Presentation Skills
Co-Occurring Skills & Capabilities in Birmingham by Category

The following tables expand on the one above by listing co-occurrences grouped by category. They cover the same employment type, locality and period, with up to 20 co-occurrences shown in each category:

Application Platforms
1 5 (26.32%) Confluence
1 5 (26.32%) nginx
Applications
1 5 (26.32%) Mozilla Thunderbird
2 1 (5.26%) Microsoft Office
Cloud Services
1 5 (26.32%) Amazon CloudWatch
1 5 (26.32%) Amazon EC2
1 5 (26.32%) Amazon ECS
1 5 (26.32%) Amazon ELB
1 5 (26.32%) Amazon S3
1 5 (26.32%) AWS
1 5 (26.32%) AWS KMS
1 5 (26.32%) Azure
1 5 (26.32%) Microsoft 365
1 5 (26.32%) Route 53
1 5 (26.32%) Virtual Private Cloud
Communications & Networking
1 5 (26.32%) DNS
1 5 (26.32%) Firewall
1 5 (26.32%) FTP
1 5 (26.32%) HTTP
1 5 (26.32%) IMAP
1 5 (26.32%) OpenLDAP
1 5 (26.32%) SMTP
1 5 (26.32%) SSH
2 1 (5.26%) LAN
2 1 (5.26%) SD-WAN
2 1 (5.26%) WAN
2 1 (5.26%) WLAN
Database & Business Intelligence
1 5 (26.32%) Amazon Aurora
1 5 (26.32%) Amazon RDS
1 5 (26.32%) PostgreSQL
Development Applications
1 5 (26.32%) Git
1 5 (26.32%) Jenkins
1 5 (26.32%) JIRA
1 5 (26.32%) Vagrant
General
1 16 (84.21%) Social Skills
2 7 (36.84%) Public Sector
3 6 (31.58%) Inclusion and Diversity
4 4 (21.05%) Finance
5 2 (10.53%) Influencing Skills
6 1 (5.26%) Czech Language
6 1 (5.26%) Marketing
6 1 (5.26%) Organisational Skills
Job Titles
1 5 (26.32%) AWS DevOps
1 5 (26.32%) AWS DevOps Engineer
1 5 (26.32%) AWS Engineer
1 5 (26.32%) AWS Platform Engineer
1 5 (26.32%) Cloud Platform Engineer
1 5 (26.32%) DevOps Engineer
1 5 (26.32%) DevOps Platform Engineer
1 5 (26.32%) Platform Engineer
2 4 (21.05%) Development Specialist
3 2 (10.53%) Analyst
3 2 (10.53%) Consultant
3 2 (10.53%) Credit Analyst
3 2 (10.53%) Credit Risk Analyst
3 2 (10.53%) Head of Information
3 2 (10.53%) Head of Information Security
3 2 (10.53%) Head of Security
3 2 (10.53%) Junior
3 2 (10.53%) Lead
3 2 (10.53%) Risk Analyst
4 1 (5.26%) Automation Consultant
Libraries, Frameworks & Software Standards
1 5 (26.32%) LDAP
Miscellaneous
1 5 (26.32%) Replication
2 2 (10.53%) Algorithms
2 2 (10.53%) Credit Risk
2 2 (10.53%) Security Posture
3 1 (5.26%) Driving Licence
3 1 (5.26%) Product Ownership
Operating Systems
1 5 (26.32%) Amazon Linux
1 5 (26.32%) Linux
1 5 (26.32%) Ubuntu
1 5 (26.32%) VMS
1 5 (26.32%) Windows
Processes & Methodologies
1 6 (31.58%) Analytics
1 6 (31.58%) Stakeholder Management
2 5 (26.32%) Change Management
2 5 (26.32%) CI/CD
2 5 (26.32%) Cloud Security
2 5 (26.32%) Coaching
2 5 (26.32%) Configuration Management
2 5 (26.32%) DevOps
2 5 (26.32%) Patch Management
2 5 (26.32%) Performance Tuning
2 5 (26.32%) Platform Engineering
3 4 (21.05%) Business Strategy
3 4 (21.05%) Decision-Making
3 4 (21.05%) Programme Management
3 4 (21.05%) Stakeholder Engagement
4 3 (15.79%) Cybersecurity
5 2 (10.53%) Data Visualisation
5 2 (10.53%) Information Governance
5 2 (10.53%) Machine Learning
5 2 (10.53%) Predictive Modelling
Programming Languages
1 7 (36.84%) Python
1 7 (36.84%) SQL
2 5 (26.32%) Groovy
2 5 (26.32%) PowerShell
3 2 (10.53%) R
4 1 (5.26%) Java
Qualifications
1 7 (36.84%) Degree
2 5 (26.32%) AWS Certification
2 5 (26.32%) Azure Certification
2 5 (26.32%) SC Cleared
2 5 (26.32%) Security Cleared
3 2 (10.53%) Computer Science Degree
Quality Assurance & Compliance
1 2 (10.53%) COBIT
1 2 (10.53%) Cyber Essentials
1 2 (10.53%) ISO/IEC 27001
1 2 (10.53%) NIST
2 1 (5.26%) PMO
System Software
1 5 (26.32%) DFS Replication
1 5 (26.32%) Docker
1 5 (26.32%) Dovecot
1 5 (26.32%) Postfix
1 5 (26.32%) Squid
Systems Management
1 5 (26.32%) Grafana
1 5 (26.32%) Nessus
1 5 (26.32%) Prometheus
1 5 (26.32%) Proxmox
1 5 (26.32%) Terraform
2 1 (5.26%) Automic
Vendors
1 5 (26.32%) Jaspersoft
1 5 (26.32%) ServiceNow
2 3 (15.79%) Salesforce
3 1 (5.26%) Broadcom
3 1 (5.26%) Cisco
3 1 (5.26%) Extreme Networks
3 1 (5.26%) Fortinet
3 1 (5.26%) Microsoft