DevOps Jobs in the East of England

DevOps
England > East of England

The following table provides summary statistics for permanent job vacancies advertised in the East of England with a requirement for DevOps skills. Included is a benchmarking guide to the salaries offered in vacancies that have cited DevOps over the 6 months to 6 December 2023 with a comparison to the same period in the previous 2 years.

6 months to
6 Dec 2023
Same period 2022 Same period 2021
Rank 18 20 18
Rank change year-on-year +2 -2 -2
Permanent jobs citing DevOps 171 587 553
As % of all permanent jobs advertised in the East of England 8.63% 10.28% 9.83%
As % of the Processes & Methodologies category 9.30% 10.86% 10.44%
Number of salaries quoted 129 258 295
10th Percentile £47,500 £45,875 £37,500
25th Percentile £57,500 £52,500 £48,750
Median annual salary (50th Percentile) £65,000 £67,500 £60,000
Median % change year-on-year -3.70% +12.50% -
75th Percentile £76,250 £85,000 £75,000
90th Percentile £87,500 £92,500 £85,000
England median annual salary £70,000 £70,000 £70,000
% change year-on-year - - +12.00%

All Process and Methodology Skills
East of England

DevOps is in the Processes and Methodologies category. The following table is for comparison with the above and provides summary statistics for all permanent job vacancies advertised in the East of England with a requirement for process or methodology skills.

Permanent vacancies with a requirement for process or methodology skills 1,839 5,403 5,297
As % of all permanent jobs advertised in the East of England 92.79% 94.59% 94.20%
Number of salaries quoted 1,283 2,541 2,734
10th Percentile £27,000 £29,000 £26,250
25th Percentile £39,000 £37,500 £34,472
Median annual salary (50th Percentile) £55,000 £55,000 £48,000
Median % change year-on-year - +14.58% +1.05%
75th Percentile £69,000 £68,750 £63,750
90th Percentile £85,000 £85,000 £75,000
England median annual salary £60,000 £62,500 £60,000
% change year-on-year -4.00% +4.17% +9.09%

DevOps
Job Vacancy Trend in the East of England

Job postings citing DevOps as a proportion of all IT jobs advertised in the East of England.
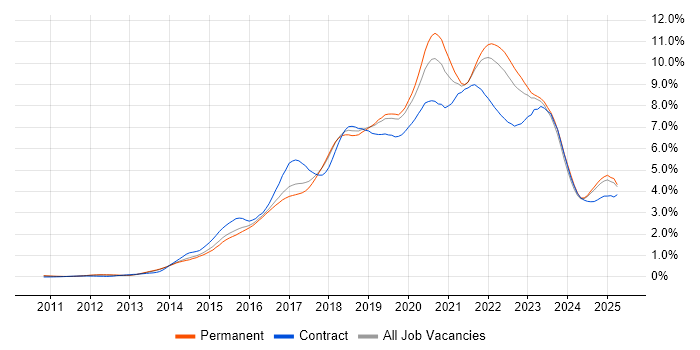
Job vacancy trend for DevOps in the East of England

DevOps
Salary Trend in the East of England

3-month moving average salary quoted in jobs citing DevOps in the East of England.

Salary trend for DevOps in the East of England

DevOps
Salary Histogram in the East of England

Salary distribution for jobs citing DevOps in the East of England over the 6 months to 6 December 2023.

Salary histogram for DevOps in the East of England

DevOps
Job Locations in the East of England

The table below looks at the demand and provides a guide to the median salaries quoted in IT jobs citing DevOps within the East of England region over the 6 months to 6 December 2023. The 'Rank Change' column provides an indication of the change in demand within each location based on the same 6 month period last year.

Location Rank Change
on Same Period
Last Year
Matching
Permanent
IT Job Ads
Median Salary
Past 6 Months
Median Salary
% Change
on Same Period
Last Year
Live
Jobs
Hertfordshire +5 56 £65,000 - 28
Essex +7 37 £82,500 - 12
Cambridgeshire -3 32 £64,500 -4.44% 29
Suffolk +5 21 £60,000 +14.29% 4
Bedfordshire -6 14 £58,750 -26.56% 5
Norfolk +10 10 £60,000 +41.18% 11
DevOps
England

DevOps
Co-occurring Skills and Capabilities in the East of England by Category

The follow tables expand on the table above by listing co-occurrences grouped by category. The same employment type, locality and period is covered with up to 20 co-occurrences shown in each of the following categories:

Application Platforms
1 12 (7.02%) Confluence
2 8 (4.68%) SharePoint
3 4 (2.34%) nginx
4 3 (1.75%) Apache
4 3 (1.75%) CMS
4 3 (1.75%) DNN
5 1 (0.58%) JBoss
5 1 (0.58%) Red Hat Fuse
5 1 (0.58%) Smallworld
5 1 (0.58%) Tomcat
Applications
1 6 (3.51%) Microsoft Excel
2 4 (2.34%) Microsoft Office
3 1 (0.58%) Microsoft PowerPoint
3 1 (0.58%) Microsoft Project
Business Applications
1 2 (1.17%) Dynamics GP
1 2 (1.17%) iTrent
1 2 (1.17%) Unit4 Business World
2 1 (0.58%) Dynamics AX
2 1 (0.58%) Dynamics CRM
2 1 (0.58%) Magento
Cloud Services
1 89 (52.05%) Azure
2 63 (36.84%) AWS
3 48 (28.07%) Azure DevOps
4 24 (14.04%) Serverless
5 19 (11.11%) Amazon EKS
6 18 (10.53%) Amazon EC2
7 16 (9.36%) Power Platform
8 13 (7.60%) Amazon S3
9 12 (7.02%) Dynamics 365
10 11 (6.43%) AWS Lambda
11 10 (5.85%) Route 53
11 10 (5.85%) SaaS
12 9 (5.26%) Amazon ECS
13 8 (4.68%) Azure Functions
13 8 (4.68%) GitHub
14 7 (4.09%) Azure Logic Apps
14 7 (4.09%) Power Automate
15 6 (3.51%) PowerApps
16 5 (2.92%) Microsoft 365
16 5 (2.92%) Virtual Private Cloud
Communications & Networking
1 6 (3.51%) Firewall
2 4 (2.34%) BGP
2 4 (2.34%) VPN
3 3 (1.75%) Ethernet
3 3 (1.75%) LAN
3 3 (1.75%) Modbus
3 3 (1.75%) RS-232
3 3 (1.75%) RS-422
3 3 (1.75%) RS-485
3 3 (1.75%) WAN
4 1 (0.58%) 5G
4 1 (0.58%) HTTP
4 1 (0.58%) Internet
4 1 (0.58%) IPsec
4 1 (0.58%) Network Security
4 1 (0.58%) OSPF
4 1 (0.58%) SAN
4 1 (0.58%) Software-Defined Networking
4 1 (0.58%) SSL
4 1 (0.58%) TCP/IP
Database & Business Intelligence
1 21 (12.28%) SQL Server
2 19 (11.11%) MongoDB
3 13 (7.60%) Power BI
4 10 (5.85%) MySQL
5 9 (5.26%) Amazon RDS
6 8 (4.68%) PostgreSQL
7 6 (3.51%) BusinessObjects
8 5 (2.92%) Tableau
9 4 (2.34%) Elasticsearch
10 3 (1.75%) Amazon Redshift
10 3 (1.75%) Big Data
10 3 (1.75%) Data Warehouse
10 3 (1.75%) SQL Server Reporting Services
11 2 (1.17%) Azure SQL Database
11 2 (1.17%) Neo4j
12 1 (0.58%) Amazon QuickSight
12 1 (0.58%) Data Lake
12 1 (0.58%) Electronic Patient Records
12 1 (0.58%) Oracle Database
12 1 (0.58%) Relational Database
Development Applications
1 38 (22.22%) Jenkins
2 32 (18.71%) Git
3 29 (16.96%) JIRA
4 17 (9.94%) GitLab
5 16 (9.36%) Artifactory
6 15 (8.77%) SonarQube
7 8 (4.68%) Bitbucket
7 8 (4.68%) Cucumber
7 8 (4.68%) Maven
7 8 (4.68%) Selenium
8 6 (3.51%) Visual Studio
9 4 (2.34%) Atlassian Bamboo
10 3 (1.75%) Postman
10 3 (1.75%) Subversion
11 2 (1.17%) ClearCase
11 2 (1.17%) ClearQuest
11 2 (1.17%) Redmine
11 2 (1.17%) SoapUI
11 2 (1.17%) SQL Server Management Studio (SSMS)
11 2 (1.17%) TeamCity
General
1 23 (13.45%) Social Skills
2 17 (9.94%) Finance
3 10 (5.85%) Analytical Skills
3 10 (5.85%) Public Sector
4 9 (5.26%) Retail
5 7 (4.09%) Manufacturing
6 6 (3.51%) Banking
7 5 (2.92%) Organisational Skills
8 4 (2.34%) Inclusion and Diversity
8 4 (2.34%) Marketing
9 3 (1.75%) Law
9 3 (1.75%) Telecoms
10 2 (1.17%) Electronics
10 2 (1.17%) Investment Banking
10 2 (1.17%) Legal
10 2 (1.17%) Local Government
10 2 (1.17%) Publishing
10 2 (1.17%) Retail Banking
11 1 (0.58%) Games
11 1 (0.58%) Wearables
Job Titles
1 45 (26.32%) DevOps Engineer
2 44 (25.73%) Developer
3 27 (15.79%) Senior
4 23 (13.45%) Lead
5 14 (8.19%) Azure Developer
5 14 (8.19%) PHP Developer
5 14 (8.19%) PHP Laravel Developer
6 13 (7.60%) Software Engineer
7 12 (7.02%) Azure Engineer
7 12 (7.02%) Linux Engineer
8 11 (6.43%) Administrator
8 11 (6.43%) AWS Engineer
9 10 (5.85%) Analyst
9 10 (5.85%) Senior Developer
10 9 (5.26%) AWS DevOps
10 9 (5.26%) AWS DevOps Engineer
11 8 (4.68%) .NET Developer
12 7 (4.09%) Data Engineer
13 6 (3.51%) Lead DevOps
13 6 (3.51%) Lead DevOps Engineer
Libraries, Frameworks & Software Standards
1 32 (18.71%) CSS
2 31 (18.13%) HTML
3 29 (16.96%) JSON
4 26 (15.20%) .NET
5 18 (10.53%) HTML5
5 18 (10.53%) RabbitMQ
6 17 (9.94%) Elastic Stack
6 17 (9.94%) Twitter Bootstrap
7 15 (8.77%) React
8 14 (8.19%) ASP.NET
8 14 (8.19%) Laravel
8 14 (8.19%) REST
9 13 (7.60%) AngularJS
10 11 (6.43%) ASP.NET MVC
11 8 (4.68%) .NET Framework
12 7 (4.09%) Blazor
12 7 (4.09%) Entity Framework
12 7 (4.09%) jQuery
13 6 (3.51%) Kafka
13 6 (3.51%) RESTful
Miscellaneous
1 15 (8.77%) Distributed Systems
2 7 (4.09%) Enterprise Software
2 7 (4.09%) Linux Command Line
2 7 (4.09%) Product Ownership
3 5 (2.92%) Data Centre
3 5 (2.92%) Enterprise Cloud
3 5 (2.92%) Greenfield Project
3 5 (2.92%) Low-Code
4 4 (2.34%) Management Information System
5 3 (1.75%) IoT
5 3 (1.75%) Legacy Applications
5 3 (1.75%) Legacy Systems
5 3 (1.75%) Self-Motivation
6 2 (1.17%) Algorithms
6 2 (1.17%) Cyber Defence
7 1 (0.58%) Blockchain
7 1 (0.58%) Cloud Native
7 1 (0.58%) Cyber Threat
7 1 (0.58%) Hybrid Cloud
7 1 (0.58%) Security Operations Centre
Operating Systems
1 48 (28.07%) Linux
2 13 (7.60%) Windows
3 4 (2.34%) Debian
3 4 (2.34%) Ubuntu
4 2 (1.17%) Unix
5 1 (0.58%) Android
5 1 (0.58%) Embedded Linux
5 1 (0.58%) Mac OS
5 1 (0.58%) Red Hat Enterprise Linux
Processes & Methodologies
1 60 (35.09%) CI/CD
2 57 (33.33%) Agile
3 26 (15.20%) Infrastructure as Code
4 24 (14.04%) Microservices
4 24 (14.04%) Scrum
5 22 (12.87%) Continuous Delivery
6 21 (12.28%) Software Engineering
7 20 (11.70%) Test Automation
8 18 (10.53%) API Development
9 17 (9.94%) Problem-Solving
10 16 (9.36%) Continuous Integration
11 15 (8.77%) API Design
12 14 (8.19%) Deployment Automation
13 13 (7.60%) MVC
13 13 (7.60%) Unit Testing
14 12 (7.02%) Business Intelligence
14 12 (7.02%) Collaborative Working
14 12 (7.02%) Configuration Management
15 11 (6.43%) Migration
15 11 (6.43%) TDD
Programming Languages
1 39 (22.81%) SQL
2 36 (21.05%) Python
3 34 (19.88%) JavaScript
4 32 (18.71%) Java
5 29 (16.96%) C#
6 17 (9.94%) PHP
7 15 (8.77%) Ruby
8 13 (7.60%) Perl
8 13 (7.60%) PowerShell
9 11 (6.43%) C
9 11 (6.43%) C++
10 10 (5.85%) Shell Script
11 9 (5.26%) Groovy
12 8 (4.68%) Bash
13 7 (4.09%) TypeScript
14 5 (2.92%) Ada
15 4 (2.34%) T-SQL
16 3 (1.75%) Go
17 2 (1.17%) VBA
18 1 (0.58%) PL/SQL
Qualifications
1 17 (9.94%) Security Cleared
2 13 (7.60%) SC Cleared
3 10 (5.85%) Degree
4 5 (2.92%) Microsoft Certification
5 2 (1.17%) ITIL Certification
5 2 (1.17%) PRINCE2 Practitioner
6 1 (0.58%) AWS Certification
6 1 (0.58%) CCIE
6 1 (0.58%) CCNP
6 1 (0.58%) Cisco Certification
6 1 (0.58%) DV Cleared
6 1 (0.58%) ISTQB
6 1 (0.58%) Master's Degree
6 1 (0.58%) PhD
6 1 (0.58%) RHCE
Quality Assurance & Compliance
1 20 (11.70%) QA
2 1 (0.58%) Accessibility
2 1 (0.58%) Data Quality
2 1 (0.58%) ECSS
2 1 (0.58%) HL7
2 1 (0.58%) ISO/IEC 27001
2 1 (0.58%) PMO
2 1 (0.58%) SLA
System Software
1 54 (31.58%) Docker
2 7 (4.09%) Active Directory
3 5 (2.92%) VMware Infrastructure
4 1 (0.58%) Ceph
4 1 (0.58%) Gluster
4 1 (0.58%) Hyper-V
4 1 (0.58%) iptables
Systems Management
1 62 (36.26%) Terraform
2 44 (25.73%) Kubernetes
3 35 (20.47%) Ansible
4 12 (7.02%) Puppet
5 10 (5.85%) Progress Chef
6 9 (5.26%) Packer
7 6 (3.51%) Kustomize
8 5 (2.92%) Nagios
9 3 (1.75%) Prometheus
10 2 (1.17%) Grafana
10 2 (1.17%) Istio
10 2 (1.17%) Kibana
10 2 (1.17%) QRadar
11 1 (0.58%) SCCM
11 1 (0.58%) Single Sign-On
11 1 (0.58%) ZABBIX
Vendors
1 37 (21.64%) Microsoft
2 14 (8.19%) AppDynamics
3 11 (6.43%) Atlassian
4 10 (5.85%) IBM
5 6 (3.51%) SAP
5 6 (3.51%) VMware
6 5 (2.92%) Salesforce
7 4 (2.34%) Checkmarx
7 4 (2.34%) Cognos
7 4 (2.34%) Oracle
7 4 (2.34%) Veracode
8 3 (1.75%) ServiceNow
9 2 (1.17%) Databricks
9 2 (1.17%) Google
9 2 (1.17%) LogRhythm
9 2 (1.17%) Pardot
9 2 (1.17%) Splunk
10 1 (0.58%) Cisco
10 1 (0.58%) Red Hat
10 1 (0.58%) Xilinx