Analytical Skills Jobs in the East of England

Analytical Skills
England > East of England

The table below looks at the prevalence of the term Analytical Skills in permanent job vacancies in the East of England. Included is a benchmarking guide to the salaries offered in vacancies that cited Analytical Skills over the 6 months leading up to 7 July 2025, comparing them to the same period in the previous two years.

6 months to
7 Jul 2025
Same period 2024 Same period 2023
Rank 17 9 28
Rank change year-on-year -8 +19 -9
Permanent jobs citing Analytical Skills 381 654 364
As % of all permanent jobs advertised in the East of England 10.14% 9.91% 8.53%
As % of the General category 15.22% 18.91% 12.44%
Number of salaries quoted 175 334 142
10th Percentile £27,500 £27,500 £24,000
25th Percentile £31,500 £32,500 £30,000
Median annual salary (50th Percentile) £46,842 £46,000 £42,500
Median % change year-on-year +1.83% +8.24% -5.56%
75th Percentile £58,125 £58,750 £60,000
90th Percentile £75,350 £72,500 £74,500
England median annual salary £55,000 £50,000 £54,882
% change year-on-year +10.00% -8.90% -0.21%

All General Skills
East of England

Analytical Skills falls under the General Skills category. For comparison with the information above, the following table provides summary statistics for all permanent job vacancies requiring common skills in the East of England.

Permanent vacancies with a requirement for common skills 2,503 3,458 2,927
As % of all permanent jobs advertised in the East of England 66.64% 52.39% 68.63%
Number of salaries quoted 1,092 2,463 1,199
10th Percentile £26,500 £25,809 £26,000
25th Percentile £32,500 £31,149 £34,660
Median annual salary (50th Percentile) £47,500 £46,000 £51,250
Median % change year-on-year +3.26% -10.24% +7.89%
75th Percentile £60,313 £61,250 £66,250
90th Percentile £75,000 £73,750 £77,500
England median annual salary £55,000 £52,500 £60,000
% change year-on-year +4.76% -12.50% -

Analytical Skills
Job Vacancy Trend in the East of England

Job postings citing Analytical Skills as a proportion of all IT jobs advertised in the East of England.
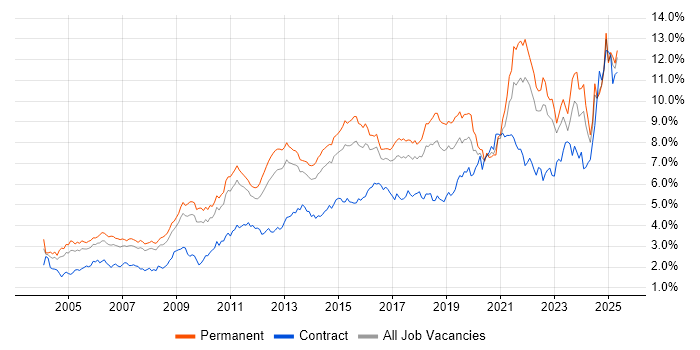
Job vacancy trend for Analytical Skills in the East of England

Analytical Skills
Salary Trend in the East of England

3-month moving average salary quoted in jobs citing Analytical Skills in the East of England.

Salary trend for Analytical Skills in the East of England

Analytical Skills
Salary Histogram in the East of England

Salary distribution for jobs citing Analytical Skills in the East of England over the 6 months to 7 July 2025.

Salary histogram for Analytical Skills in the East of England

Analytical Skills
Job Locations in the East of England

The table below looks at the demand and provides a guide to the median salaries quoted in IT jobs citing Analytical Skills within the East of England region over the 6 months to 7 July 2025. The 'Rank Change' column provides an indication of the change in demand within each location based on the same 6 month period last year.

Location Rank Change
on Same Period
Last Year
Matching
Permanent
IT Job Ads
Median Salary
Past 6 Months
Median Salary
% Change
on Same Period
Last Year
Live
Jobs
Hertfordshire +5 124 £45,000 -16.67% 106
Cambridgeshire +3 78 £49,461 -5.79% 113
Suffolk -8 67 £47,500 +72.73% 33
Essex -2 57 £38,750 -8.82% 50
Bedfordshire -10 30 £60,750 +73.57% 24
Norfolk -20 24 £31,250 -3.85% 29
East Anglia - 1 £55,000 - 32
Analytical Skills
England

Analytical Skills
Co-occurring Skills and Capabilities in the East of England by Category

The follow tables expand on the table above by listing co-occurrences grouped by category. The same employment type, locality and period is covered with up to 20 co-occurrences shown in each of the following categories:

Application Platforms
1 10 (2.62%) SharePoint
2 5 (1.31%) CMS
3 3 (0.79%) Kentico
3 3 (0.79%) Umbraco
4 1 (0.26%) Apache
4 1 (0.26%) Apache Airflow
4 1 (0.26%) OpenEdge
4 1 (0.26%) SAS
4 1 (0.26%) WebLogic
Applications
1 41 (10.76%) Microsoft Excel
2 37 (9.71%) Microsoft PowerPoint
3 17 (4.46%) Chatbot
4 13 (3.41%) Microsoft Office
5 3 (0.79%) Photoshop
6 2 (0.52%) Adobe Creative Suite
6 2 (0.52%) Adobe Illustrator
6 2 (0.52%) InDesign
6 2 (0.52%) Spreadsheet
Business Applications
1 5 (1.31%) Infor M3
2 4 (1.05%) Infor LN
2 4 (1.05%) SAP BPC
3 3 (0.79%) Shopify
4 2 (0.52%) Magento
4 2 (0.52%) NetSuite
5 1 (0.26%) Dynamics CRM
5 1 (0.26%) Primavera
5 1 (0.26%) SAP ERP
Cloud Services
1 72 (18.90%) Azure
2 58 (15.22%) AWS
3 30 (7.87%) Power Platform
4 28 (7.35%) GCP
5 26 (6.82%) AWS Lambda
5 26 (6.82%) Serverless
6 24 (6.30%) Microsoft 365
6 24 (6.30%) SaaS
7 15 (3.94%) Amazon EKS
7 15 (3.94%) AWS CloudFormation
8 14 (3.67%) Entra ID
8 14 (3.67%) Google Analytics
9 8 (2.10%) Google Ads
10 5 (1.31%) Google Tag Manager
10 5 (1.31%) OneDrive
10 5 (1.31%) PaaS
11 4 (1.05%) Google Data Studio
11 4 (1.05%) Google Sheets
11 4 (1.05%) Microsoft Advertising
11 4 (1.05%) Power Automate
Communications & Networking
1 26 (6.82%) Broadband
2 14 (3.67%) Firewall
3 10 (2.62%) WAN
4 8 (2.10%) SD-WAN
5 7 (1.84%) DNS
5 7 (1.84%) VLAN
6 6 (1.57%) DHCP
6 6 (1.57%) LAN
6 6 (1.57%) VPN
7 3 (0.79%) BGP
8 2 (0.52%) EIGRP
8 2 (0.52%) Internet
8 2 (0.52%) Network Security
8 2 (0.52%) OSPF
8 2 (0.52%) Spanning Tree
8 2 (0.52%) Unified Communications
8 2 (0.52%) VoIP
8 2 (0.52%) Wi-Fi
8 2 (0.52%) Wireshark
9 1 (0.26%) VPLS
Database & Business Intelligence
1 29 (7.61%) Power BI
2 17 (4.46%) Big Data
3 16 (4.20%) Elasticsearch
4 10 (2.62%) Power Query
4 10 (2.62%) Tableau
5 7 (1.84%) Relational Database
5 7 (1.84%) SQL Server
6 6 (1.57%) Data Warehouse
7 5 (1.31%) Crystal Reports
8 4 (1.05%) Data Lake
8 4 (1.05%) Metadata
9 3 (0.79%) BusinessObjects
9 3 (0.79%) Looker
10 1 (0.26%) MS Access
10 1 (0.26%) MySQL
10 1 (0.26%) Oracle Database
10 1 (0.26%) Oracle Reports
10 1 (0.26%) PostgreSQL
10 1 (0.26%) SQL Server Integration Services
10 1 (0.26%) SQL Server Reporting Services
Development Applications
1 7 (1.84%) JIRA
2 4 (1.05%) Git
2 4 (1.05%) Oracle Forms
3 2 (0.52%) LabVIEW
4 1 (0.26%) GDB
4 1 (0.26%) GitLab
General
1 244 (64.04%) Social Skills
2 67 (17.59%) Finance
3 53 (13.91%) Marketing
4 47 (12.34%) Inclusion and Diversity
5 33 (8.66%) Banking
6 29 (7.61%) Electronics
7 25 (6.56%) Financial Institution
7 25 (6.56%) French Language
7 25 (6.56%) German Language
8 24 (6.30%) Organisational Skills
9 23 (6.04%) Advertising
10 19 (4.99%) Aerospace
11 18 (4.72%) Aviation
11 18 (4.72%) Manufacturing
12 14 (3.67%) Public Sector
13 12 (3.15%) Retail
13 12 (3.15%) Telecoms
14 11 (2.89%) Influencing Skills
15 10 (2.62%) Legal
16 8 (2.10%) Presentation Skills
Job Titles
1 101 (26.51%) Analyst
2 72 (18.90%) Senior
3 26 (6.82%) Machine Learning Engineer
4 25 (6.56%) Credit Analyst
4 25 (6.56%) Research Analyst
4 25 (6.56%) Support Analyst
5 23 (6.04%) Developer
6 20 (5.25%) Coordinator
7 17 (4.46%) Senior Manager
7 17 (4.46%) Trainer
8 16 (4.20%) Software Developer
9 15 (3.94%) Account Manager
9 15 (3.94%) Architect
9 15 (3.94%) Senior Account Manager
10 14 (3.67%) Lead
11 13 (3.41%) 1st Line Support
11 13 (3.41%) 1st Line Support Analyst
11 13 (3.41%) Applications Support
11 13 (3.41%) Applications Support Analyst
12 11 (2.89%) Supplier Manager
Libraries, Frameworks & Software Standards
1 19 (4.99%) .NET
2 17 (4.46%) Node.js
3 15 (3.94%) Pandas
4 7 (1.84%) HTML
5 4 (1.05%) React
6 3 (0.79%) AngularJS
7 2 (0.52%) ASP.NET
7 2 (0.52%) ASP.NET Core
7 2 (0.52%) CSS
7 2 (0.52%) JSON
7 2 (0.52%) REST
7 2 (0.52%) Restlet
7 2 (0.52%) Web Services
8 1 (0.26%) EDIFACT
8 1 (0.26%) Jest
8 1 (0.26%) OpenEmbedded
8 1 (0.26%) Playwright
8 1 (0.26%) PyTorch
8 1 (0.26%) XML
8 1 (0.26%) Yocto
Miscellaneous
1 39 (10.24%) Self-Motivation
2 29 (7.61%) Analytical Mindset
3 28 (7.35%) Management Information System
4 25 (6.56%) Credit Risk
4 25 (6.56%) Fixed Income
5 15 (3.94%) Cyberattack
5 15 (3.94%) Digital Media
5 15 (3.94%) Marketing Technology
6 10 (2.62%) Social Media
7 9 (2.36%) Algorithms
7 9 (2.36%) Operational Technology
8 8 (2.10%) Driving Licence
8 8 (2.10%) SCADA
9 7 (1.84%) Data Centre
10 4 (1.05%) Life Science
10 4 (1.05%) Mobile App
10 4 (1.05%) Onboarding
11 3 (0.79%) Biopharmaceutical
11 3 (0.79%) Product Ownership
11 3 (0.79%) Renewable Energy
Operating Systems
1 19 (4.99%) Linux
2 16 (4.20%) Android
3 14 (3.67%) Windows
4 13 (3.41%) Windows Server
5 2 (0.52%) Embedded Linux
6 1 (0.26%) Red Hat Enterprise Linux
6 1 (0.26%) VMS
Processes & Methodologies
1 188 (49.34%) Problem-Solving
2 102 (26.77%) Project Management
3 74 (19.42%) Agile
4 62 (16.27%) Decision-Making
5 59 (15.49%) Mentoring
6 54 (14.17%) Collaborative Working
7 53 (13.91%) Artificial Intelligence
8 44 (11.55%) CI/CD
9 43 (11.29%) Stakeholder Engagement
10 42 (11.02%) Risk Management
11 40 (10.50%) Business Intelligence
12 39 (10.24%) Process Improvement
12 39 (10.24%) Time Management
13 38 (9.97%) ERP
13 38 (9.97%) Machine Learning
14 37 (9.71%) Data Science
15 34 (8.92%) Continuous Improvement
16 33 (8.66%) Business Strategy
16 33 (8.66%) Strategic Thinking
17 32 (8.40%) Business Enablement
Programming Languages
1 61 (16.01%) Python
2 58 (15.22%) SQL
3 27 (7.09%) TypeScript
4 24 (6.30%) JavaScript
5 19 (4.99%) C++
5 19 (4.99%) Java
6 15 (3.94%) Go
6 15 (3.94%) Rust
7 10 (2.62%) Data Analysis Expressions
8 7 (1.84%) R
9 4 (1.05%) C
9 4 (1.05%) C#
9 4 (1.05%) PL/SQL
10 2 (0.52%) Ada
11 1 (0.26%) Bash
11 1 (0.26%) Bicep
11 1 (0.26%) OpenEdge ABL
11 1 (0.26%) VBA
Qualifications
1 175 (45.93%) Degree
2 72 (18.90%) Master's Degree
3 45 (11.81%) PhD
4 25 (6.56%) CFA
5 21 (5.51%) Security Cleared
6 17 (4.46%) CBAP
6 17 (4.46%) PMI Certification
6 17 (4.46%) PMP
7 16 (4.20%) DV Cleared
8 15 (3.94%) Computer Science Degree
8 15 (3.94%) Microsoft Certification
9 12 (3.15%) BPSS Clearance
10 10 (2.62%) A+ Certification
11 8 (2.10%) ACCA
11 8 (2.10%) CIMA
12 5 (1.31%) SC Cleared
13 4 (1.05%) Numerate Degree
13 4 (1.05%) Postgraduate
14 2 (0.52%) ITIL Foundation Certificate
15 1 (0.26%) DBS Check
Quality Assurance & Compliance
1 21 (5.51%) QA
2 9 (2.36%) Data Quality
3 7 (1.84%) GxP
4 6 (1.57%) GDPR
5 4 (1.05%) GAAP
5 4 (1.05%) IFRS
5 4 (1.05%) NEBOSH
6 3 (0.79%) Actionable Recommendations
6 3 (0.79%) GMP
7 2 (0.52%) GRC
7 2 (0.52%) IEC 62304
7 2 (0.52%) ISO 13485
8 1 (0.26%) COBIT
8 1 (0.26%) Cyber Essentials
8 1 (0.26%) Cyber Essentials PLUS
8 1 (0.26%) ISO/IEC 27001
8 1 (0.26%) JTAG
8 1 (0.26%) NIST
8 1 (0.26%) PMO
8 1 (0.26%) Sarbanes-Oxley
System Software
1 26 (6.82%) Active Directory
2 18 (4.72%) Docker
3 6 (1.57%) Hyper-V
4 1 (0.26%) Firmware
4 1 (0.26%) Virtual Machines
Systems Management
1 17 (4.46%) Kubernetes
2 16 (4.20%) Ansible
2 16 (4.20%) Terraform
3 6 (1.57%) Active Directory Federation Services
4 5 (1.31%) Microsoft Intune
Vendors
1 57 (14.96%) Microsoft
2 25 (6.56%) Bloomberg
3 23 (6.04%) Google
4 17 (4.46%) PayPal
4 17 (4.46%) YouTube
5 11 (2.89%) Oracle
6 9 (2.36%) Infor
6 9 (2.36%) SAP
7 7 (1.84%) Salesforce
8 6 (1.57%) Citrix
8 6 (1.57%) Screaming Frog
9 5 (1.31%) Ahrefs
9 5 (1.31%) IFS
9 5 (1.31%) Manugistics
9 5 (1.31%) Palo Alto
9 5 (1.31%) WatchGuard
10 4 (1.05%) Cognos
10 4 (1.05%) HubSpot
10 4 (1.05%) ServiceNow
11 3 (0.79%) Cisco