Linux Jobs in the East of England

Linux
England > East of England

The following table provides summary statistics for permanent job vacancies advertised in the East of England with a requirement for Linux skills. Included is a benchmarking guide to the salaries offered in vacancies that have cited Linux over the 6 months to 30 November 2023 with a comparison to the same period in the previous 2 years.

6 months to
30 Nov 2023
Same period 2022 Same period 2021
Rank 22 23 33
Rank change year-on-year +1 +10 -16
Permanent jobs citing Linux 154 531 373
As % of all permanent jobs advertised in the East of England 7.65% 9.30% 6.52%
As % of the Operating Systems category 37.29% 43.88% 35.46%
Number of salaries quoted 103 236 220
10th Percentile £40,000 £32,500 £31,250
25th Percentile £43,750 £45,000 £38,750
Median annual salary (50th Percentile) £65,000 £60,000 £55,000
Median % change year-on-year +8.33% +9.09% +10.00%
75th Percentile £73,750 £72,000 £70,000
90th Percentile £83,750 £88,125 £76,250
England median annual salary £60,000 £62,500 £60,000
% change year-on-year -4.00% +4.17% +9.09%

All Operating Systems
East of England

Linux is in the Operating Systems category. The following table is for comparison with the above and provides summary statistics for all permanent job vacancies advertised in the East of England with a requirement for operating system skills.

Permanent vacancies with a requirement for operating system skills 413 1,210 1,052
As % of all permanent jobs advertised in the East of England 20.51% 21.20% 18.40%
Number of salaries quoted 312 711 709
10th Percentile £25,750 £25,500 £21,750
25th Percentile £30,000 £31,250 £26,500
Median annual salary (50th Percentile) £42,500 £42,500 £40,000
Median % change year-on-year - +6.25% -11.11%
75th Percentile £60,625 £60,000 £56,250
90th Percentile £80,000 £72,000 £68,750
England median annual salary £50,000 £52,500 £50,000
% change year-on-year -4.76% +5.00% -

Linux
Job Vacancy Trend in the East of England

Job postings citing Linux as a proportion of all IT jobs advertised in the East of England.
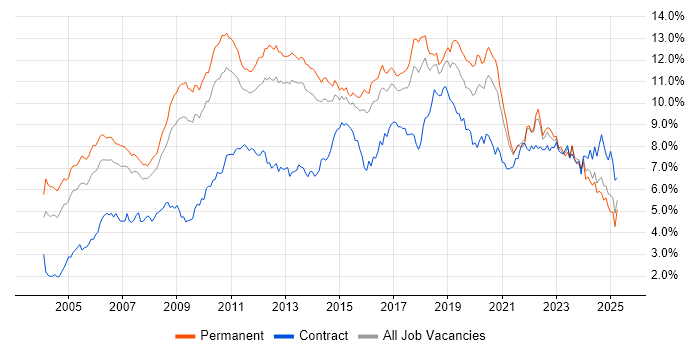
Job vacancy trend for Linux in the East of England

Linux
Salary Trend in the East of England

3-month moving average salary quoted in jobs citing Linux in the East of England.

Salary trend for Linux in the East of England

Linux
Salary Histogram in the East of England

Salary distribution for jobs citing Linux in the East of England over the 6 months to 30 November 2023.

Salary histogram for Linux in the East of England

Linux
Job Locations in the East of England

The table below looks at the demand and provides a guide to the median salaries quoted in IT jobs citing Linux within the East of England region over the 6 months to 30 November 2023. The 'Rank Change' column provides an indication of the change in demand within each location based on the same 6 month period last year.

Location Rank Change
on Same Period
Last Year
Matching
Permanent
IT Job Ads
Median Salary
Past 6 Months
Median Salary
% Change
on Same Period
Last Year
Live
Jobs
Cambridgeshire +4 61 £52,500 -12.50% 100
Hertfordshire -3 45 £65,000 +13.04% 28
Essex +13 33 £82,500 - 14
Bedfordshire +20 8 £65,000 +18.18% 13
Norfolk +9 5 £42,500 +14.86% 4
Suffolk -4 2 £110,000 +52.78% 3
Linux
England

Linux
Co-occurring Skills and Capabilities in the East of England by Category

The follow tables expand on the table above by listing co-occurrences grouped by category. The same employment type, locality and period is covered with up to 20 co-occurrences shown in each of the following categories:

Application Platforms
1 15 (9.74%) SharePoint
2 3 (1.95%) Apache
2 3 (1.95%) Confluence
2 3 (1.95%) nginx
3 1 (0.65%) Alfresco
3 1 (0.65%) Apache Solr
3 1 (0.65%) JBoss
3 1 (0.65%) Oracle Application Server
3 1 (0.65%) Red Hat Fuse
3 1 (0.65%) Tomcat
3 1 (0.65%) WebLogic
3 1 (0.65%) WordPress
Applications
1 1 (0.65%) Microsoft Office
Business Applications
1 1 (0.65%) Dynamics AX
1 1 (0.65%) Dynamics CRM
Cloud Services
1 48 (31.17%) AWS
2 41 (26.62%) Azure
3 19 (12.34%) Amazon EC2
4 18 (11.69%) Microsoft 365
5 17 (11.04%) Serverless
6 15 (9.74%) Amazon EKS
7 12 (7.79%) Amazon S3
8 9 (5.84%) AWS Lambda
8 9 (5.84%) Route 53
9 8 (5.19%) Azure DevOps
10 7 (4.55%) SaaS
11 5 (3.25%) Amazon ECS
11 5 (3.25%) Virtual Private Cloud
12 4 (2.60%) GCP
13 3 (1.95%) Amazon CloudWatch
13 3 (1.95%) AWS CloudFormation
13 3 (1.95%) Cloud Computing
13 3 (1.95%) GitHub
14 2 (1.30%) Entra ID
14 2 (1.30%) Mimecast
Communications & Networking
1 24 (15.58%) Firewall
2 10 (6.49%) Network Security
3 5 (3.25%) VPN
4 3 (1.95%) BGP
4 3 (1.95%) LAN
4 3 (1.95%) TCP/IP
5 2 (1.30%) DNS
5 2 (1.30%) LoRaWAN
5 2 (1.30%) LTE
5 2 (1.30%) MQTT
5 2 (1.30%) VLAN
5 2 (1.30%) WAN
5 2 (1.30%) Wireless
6 1 (0.65%) DHCP
6 1 (0.65%) SAN
6 1 (0.65%) Skype
6 1 (0.65%) Software-Defined Networking
6 1 (0.65%) SSL
6 1 (0.65%) VoIP
6 1 (0.65%) WLAN
Database & Business Intelligence
1 13 (8.44%) PostgreSQL
2 11 (7.14%) MySQL
3 8 (5.19%) Amazon RDS
4 6 (3.90%) MongoDB
4 6 (3.90%) SQL Server
5 5 (3.25%) Elasticsearch
6 3 (1.95%) Big Data
6 3 (1.95%) Firebird
7 1 (0.65%) GIS
7 1 (0.65%) Power BI
7 1 (0.65%) Relational Database
Development Applications
1 33 (21.43%) Git
2 20 (12.99%) Jenkins
3 16 (10.39%) JIRA
4 15 (9.74%) Artifactory
4 15 (9.74%) SonarQube
5 10 (6.49%) GitLab
6 8 (5.19%) Cucumber
7 7 (4.55%) Bitbucket
8 5 (3.25%) Subversion
9 4 (2.60%) Atlassian Bamboo
9 4 (2.60%) Maven
10 2 (1.30%) ClearCase
10 2 (1.30%) ClearQuest
10 2 (1.30%) Redmine
10 2 (1.30%) Sonatype Nexus
11 1 (0.65%) Android Studio
11 1 (0.65%) MSI
11 1 (0.65%) PetaLinux
11 1 (0.65%) TeamCity
11 1 (0.65%) Xcode
General
1 25 (16.23%) Social Skills
2 23 (14.94%) Marketing
3 17 (11.04%) Analytical Skills
4 14 (9.09%) Finance
5 13 (8.44%) Influencing Skills
6 10 (6.49%) Games
7 9 (5.84%) Public Sector
8 8 (5.19%) Electronics
9 5 (3.25%) Manufacturing
9 5 (3.25%) Organisational Skills
10 4 (2.60%) Aerospace
10 4 (2.60%) Automotive
10 4 (2.60%) Law
11 3 (1.95%) Legal
11 3 (1.95%) Telecoms
12 1 (0.65%) Agrochemical
12 1 (0.65%) Documentation Skills
12 1 (0.65%) Inclusion and Diversity
12 1 (0.65%) Pharmaceutical
12 1 (0.65%) Retail
Job Titles
1 31 (20.13%) Senior
2 28 (18.18%) DevOps Engineer
3 20 (12.99%) Architect
3 20 (12.99%) Linux Engineer
4 19 (12.34%) Infrastructure Engineer
4 19 (12.34%) Lead
5 18 (11.69%) Principal Architect
6 17 (11.04%) Software Engineer
7 13 (8.44%) Senior Architect
7 13 (8.44%) Senior Software Architect
7 13 (8.44%) Software Architect
8 12 (7.79%) IT Engineer
9 11 (7.14%) Administrator
9 11 (7.14%) Developer
10 10 (6.49%) Graphics Engineer
10 10 (6.49%) Graphics Software Engineer
10 10 (6.49%) IT Support
11 9 (5.84%) AWS Engineer
11 9 (5.84%) IT Support Engineer
11 9 (5.84%) Support Engineer
Libraries, Frameworks & Software Standards
1 21 (13.64%) Elastic Stack
2 14 (9.09%) RabbitMQ
3 13 (8.44%) OpenGL
3 13 (8.44%) Vulkan
4 12 (7.79%) Unity (Game Engine)
5 10 (6.49%) JSON
5 10 (6.49%) OpenGL ES
6 9 (5.84%) Unreal Engine
6 9 (5.84%) WebAssembly
6 9 (5.84%) WebGPU
7 8 (5.19%) REST
8 7 (4.55%) CSS
8 7 (4.55%) HTML
8 7 (4.55%) LDAP
8 7 (4.55%) React
9 5 (3.25%) ADO
9 5 (3.25%) CSS3
9 5 (3.25%) HTML5
9 5 (3.25%) jQuery
9 5 (3.25%) Laravel
Miscellaneous
1 22 (14.29%) Mali
2 16 (10.39%) Smartphone
3 15 (9.74%) Data Centre
4 13 (8.44%) Embedded Systems
5 12 (7.79%) Linux Command Line
6 11 (7.14%) Distributed Systems
7 10 (6.49%) Public Cloud
8 9 (5.84%) Handset
8 9 (5.84%) Life Science
8 9 (5.84%) Ray Tracing
8 9 (5.84%) SIMD
9 8 (5.19%) Driving Licence
9 8 (5.19%) Greenfield Project
10 5 (3.25%) ARM Cortex
10 5 (3.25%) IoT
11 4 (2.60%) Mobile App
12 3 (1.95%) Algorithms
12 3 (1.95%) Augmented Reality
12 3 (1.95%) CUDA
12 3 (1.95%) Virtual Reality
Operating Systems
1 56 (36.36%) Windows
2 32 (20.78%) Android
3 19 (12.34%) Windows Server
4 15 (9.74%) Red Hat Enterprise Linux
5 13 (8.44%) Debian
6 12 (7.79%) Mac OS
7 8 (5.19%) Ubuntu
8 5 (3.25%) Unix
9 2 (1.30%) Solaris
9 2 (1.30%) Windows XP
10 1 (0.65%) Apple iOS
10 1 (0.65%) Embedded Linux
10 1 (0.65%) Mac OS X
10 1 (0.65%) Windows 10
Processes & Methodologies
1 48 (31.17%) DevOps
2 32 (20.78%) CI/CD
3 30 (19.48%) Agile
4 25 (16.23%) Software Engineering
5 23 (14.94%) Mathematics
6 21 (13.64%) Infrastructure Engineering
6 21 (13.64%) ITIL
7 19 (12.34%) Computer Science
7 19 (12.34%) Performance Analysis
7 19 (12.34%) Problem-Solving
8 16 (10.39%) Cybersecurity
8 16 (10.39%) Infrastructure as Code
8 16 (10.39%) Microservices
8 16 (10.39%) Roadmaps
8 16 (10.39%) Technical Leadership
9 15 (9.74%) Machine Learning
9 15 (9.74%) SIEM
10 14 (9.09%) Deployment Automation
10 14 (9.09%) Security Hardening
10 14 (9.09%) Software Architecture
Programming Languages
1 48 (31.17%) C
2 39 (25.32%) C++
2 39 (25.32%) Python
3 22 (14.29%) Java
4 21 (13.64%) SQL
5 15 (9.74%) Perl
6 12 (7.79%) JavaScript
6 12 (7.79%) Ruby
7 11 (7.14%) Shell Script
8 10 (6.49%) PowerShell
9 9 (5.84%) Rust
10 8 (5.19%) Groovy
11 6 (3.90%) Bash
11 6 (3.90%) PHP
12 3 (1.95%) Go
12 3 (1.95%) TypeScript
13 2 (1.30%) C#
14 1 (0.65%) AWK
14 1 (0.65%) Objective-C
14 1 (0.65%) VB
Qualifications
1 24 (15.58%) Degree
2 21 (13.64%) Security Cleared
3 13 (8.44%) SC Cleared
4 11 (7.14%) Computer Science Degree
4 11 (7.14%) ITIL Certification
5 6 (3.90%) Microsoft Certification
6 3 (1.95%) Cisco Certification
7 2 (1.30%) (ISC)2 CCSP
7 2 (1.30%) CCSP
7 2 (1.30%) CEH
7 2 (1.30%) CISA
7 2 (1.30%) CISM
7 2 (1.30%) CISSP
7 2 (1.30%) CompTIA Security+
7 2 (1.30%) DV Cleared
7 2 (1.30%) OSCP
8 1 (0.65%) A+ Certification
8 1 (0.65%) DBS Check
8 1 (0.65%) Network+ Certification
8 1 (0.65%) RHCE
Quality Assurance & Compliance
1 13 (8.44%) QA
2 10 (6.49%) ISO/IEC 27001
3 6 (3.90%) SLA
4 1 (0.65%) Cyber Essentials
4 1 (0.65%) ECSS
4 1 (0.65%) JTAG
System Software
1 31 (20.13%) Docker
2 27 (17.53%) VMware Infrastructure
3 26 (16.88%) Active Directory
4 18 (11.69%) Firmware
5 16 (10.39%) Embedded Firmware
6 12 (7.79%) Hyper-V
7 1 (0.65%) Ceph
7 1 (0.65%) Gluster
7 1 (0.65%) iptables
7 1 (0.65%) Virtual Desktop
7 1 (0.65%) Virtual Machines
7 1 (0.65%) VMware ESXi
7 1 (0.65%) vSphere
Systems Management
1 44 (28.57%) Terraform
2 30 (19.48%) Kubernetes
3 29 (18.83%) Ansible
4 10 (6.49%) Puppet
5 9 (5.84%) Packer
6 7 (4.55%) Nagios
7 6 (3.90%) Kustomize
7 6 (3.90%) Progress Chef
8 4 (2.60%) ZABBIX
9 3 (1.95%) Grafana
9 3 (1.95%) SCCM
9 3 (1.95%) SCOM
10 2 (1.30%) Istio
10 2 (1.30%) Prometheus
11 1 (0.65%) Fluentd
11 1 (0.65%) Kibana
11 1 (0.65%) logstash
11 1 (0.65%) Rancher
11 1 (0.65%) vCenter Server
Vendors
1 39 (25.32%) Microsoft
2 29 (18.83%) VMware
3 13 (8.44%) AppDynamics
4 11 (7.14%) Red Hat
5 10 (6.49%) Atlassian
6 9 (5.84%) Cisco
6 9 (5.84%) IBM
7 6 (3.90%) Google
8 4 (2.60%) NetApp
8 4 (2.60%) Oracle
8 4 (2.60%) Veeam
9 3 (1.95%) SAP
10 2 (1.30%) Apple
10 2 (1.30%) HP
10 2 (1.30%) Lotus
10 2 (1.30%) Splunk
11 1 (0.65%) Adobe
11 1 (0.65%) Dynatrace
11 1 (0.65%) McAfee
11 1 (0.65%) New Relic