AWS Jobs in the East of England

Amazon Web Services (AWS)
England > East of England

The following table provides summary statistics for permanent job vacancies advertised in the East of England with a requirement for AWS skills. Included is a benchmarking guide to the salaries offered in vacancies that have cited AWS over the 6 months to 1 December 2023 with a comparison to the same period in the previous 2 years.

6 months to
1 Dec 2023
Same period 2022 Same period 2021
Rank 17 8 12
Rank change year-on-year -9 +4 -4
Permanent jobs citing AWS 175 883 693
As % of all permanent jobs advertised in the East of England 8.72% 15.39% 12.14%
As % of the Cloud Services category 26.12% 42.93% 35.45%
Number of salaries quoted 136 376 407
10th Percentile £40,000 £37,500 £37,500
25th Percentile £55,938 £47,500 £45,000
Median annual salary (50th Percentile) £65,000 £60,000 £60,000
Median % change year-on-year +8.33% - -
75th Percentile £80,000 £80,000 £71,000
90th Percentile £84,750 £88,750 £82,500
England median annual salary £72,500 £75,000 £70,000
% change year-on-year -3.33% +7.14% +7.69%

All Cloud Skills
East of England

AWS is in the Cloud Services category. The following table is for comparison with the above and provides summary statistics for all permanent job vacancies advertised in the East of England with a requirement for cloud computing skills.

Permanent vacancies with a requirement for cloud computing skills 670 2,057 1,955
As % of all permanent jobs advertised in the East of England 33.37% 35.85% 34.26%
Number of salaries quoted 562 1,162 1,308
10th Percentile £27,000 £30,000 £26,000
25th Percentile £34,000 £37,500 £34,000
Median annual salary (50th Percentile) £50,000 £55,000 £50,000
Median % change year-on-year -9.09% +10.00% +5.26%
75th Percentile £68,750 £68,750 £65,000
90th Percentile £84,950 £86,250 £75,000
England median annual salary £62,500 £65,000 £60,000
% change year-on-year -3.85% +8.33% -

AWS
Job Vacancy Trend in the East of England

Job postings citing AWS as a proportion of all IT jobs advertised in the East of England.
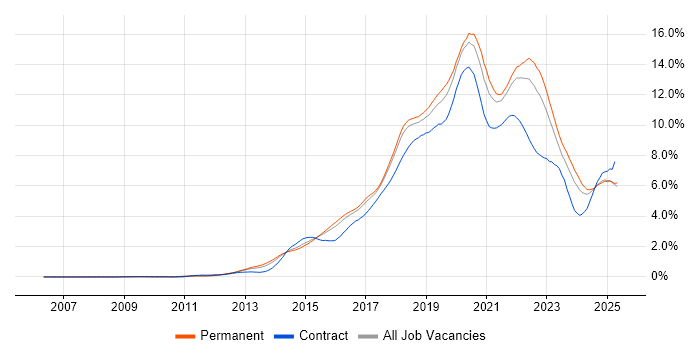
Job vacancy trend for AWS in the East of England

AWS
Salary Trend in the East of England

3-month moving average salary quoted in jobs citing AWS in the East of England.

Salary trend for AWS in the East of England

AWS
Salary Histogram in the East of England

Salary distribution for jobs citing AWS in the East of England over the 6 months to 1 December 2023.

Salary histogram for AWS in the East of England

AWS
Job Locations in the East of England

The table below looks at the demand and provides a guide to the median salaries quoted in IT jobs citing AWS within the East of England region over the 6 months to 1 December 2023. The 'Rank Change' column provides an indication of the change in demand within each location based on the same 6 month period last year.

Location Rank Change
on Same Period
Last Year
Matching
Permanent
IT Job Ads
Median Salary
Past 6 Months
Median Salary
% Change
on Same Period
Last Year
Live
Jobs
Cambridgeshire -3 65 £65,000 +18.18% 58
Hertfordshire -13 46 £70,000 +16.67% 38
Essex -10 30 £82,500 +33.06% 11
Suffolk -3 18 £60,000 +4.35% 1
Bedfordshire -4 13 £65,000 -25.71% 11
Norfolk -10 3 £65,000 +30.00% 11
AWS
England

AWS
Co-occurring Skills and Capabilities in the East of England by Category

The follow tables expand on the table above by listing co-occurrences grouped by category. The same employment type, locality and period is covered with up to 20 co-occurrences shown in each of the following categories:

Application Platforms
1 13 (7.43%) SharePoint
2 6 (3.43%) Apache
3 3 (1.71%) Apache Spark
3 3 (1.71%) Confluence
4 2 (1.14%) nginx
4 2 (1.14%) WordPress
5 1 (0.57%) CMS
5 1 (0.57%) Drupal
5 1 (0.57%) IBM Domino
5 1 (0.57%) JBoss
5 1 (0.57%) Red Hat Fuse
Applications
1 4 (2.29%) Microsoft Office
2 3 (1.71%) Microsoft Excel
Business Applications
1 2 (1.14%) Dynamics CRM
2 1 (0.57%) Dynamics AX
Cloud Services
1 87 (49.71%) Azure
2 38 (21.71%) Serverless
3 28 (16.00%) Amazon EC2
4 22 (12.57%) AWS Lambda
5 21 (12.00%) SaaS
6 19 (10.86%) Amazon EKS
7 18 (10.29%) Amazon S3
8 15 (8.57%) GitHub
9 14 (8.00%) Microsoft 365
10 10 (5.71%) Route 53
11 9 (5.14%) Amazon ECS
11 9 (5.14%) Cloud Computing
11 9 (5.14%) GCP
11 9 (5.14%) Power Platform
12 8 (4.57%) Amazon Cognito
13 7 (4.00%) Azure Sentinel
14 6 (3.43%) AWS Fargate
15 5 (2.86%) Google Workspace
15 5 (2.86%) Virtual Private Cloud
16 4 (2.29%) Amazon EMR
Communications & Networking
1 19 (10.86%) Firewall
2 8 (4.57%) VPN
3 5 (2.86%) F5 BIG-IP LTM
3 5 (2.86%) Wireless
4 3 (1.71%) BGP
4 3 (1.71%) DNS
4 3 (1.71%) LAN
4 3 (1.71%) NAS
4 3 (1.71%) SAN
4 3 (1.71%) VoIP
4 3 (1.71%) WAN
5 2 (1.14%) DHCP
5 2 (1.14%) LoRaWAN
5 2 (1.14%) LTE
5 2 (1.14%) MQTT
5 2 (1.14%) Network Security
6 1 (0.57%) Reverse Proxy
6 1 (0.57%) Software-Defined Networking
6 1 (0.57%) VLAN
Database & Business Intelligence
1 22 (12.57%) MySQL
2 19 (10.86%) MongoDB
3 17 (9.71%) Amazon RDS
4 11 (6.29%) Amazon Redshift
5 8 (4.57%) Power BI
6 7 (4.00%) Amazon QuickSight
7 6 (3.43%) Big Data
7 6 (3.43%) Data Warehouse
7 6 (3.43%) DynamoDB
8 5 (2.86%) Relational Database
8 5 (2.86%) Tableau
9 4 (2.29%) Amazon Athena
9 4 (2.29%) Elasticsearch
9 4 (2.29%) PostgreSQL
10 3 (1.71%) Apache Hive
10 3 (1.71%) Delta Lake
10 3 (1.71%) Hadoop
11 2 (1.14%) BusinessObjects
11 2 (1.14%) SQL Server
12 1 (0.57%) GIS
Development Applications
1 40 (22.86%) Git
2 35 (20.00%) Jenkins
3 22 (12.57%) JIRA
4 13 (7.43%) Artifactory
4 13 (7.43%) SonarQube
5 12 (6.86%) Maven
6 11 (6.29%) Cucumber
6 11 (6.29%) GitLab
7 7 (4.00%) IntelliJ
8 3 (1.71%) Subversion
9 2 (1.14%) Bitbucket
9 2 (1.14%) Bitbucket Server
9 2 (1.14%) JMeter
9 2 (1.14%) Selenium
9 2 (1.14%) Serenity BDD
9 2 (1.14%) TeamCity
10 1 (0.57%) Hudson
10 1 (0.57%) SoapUI
General
1 38 (21.71%) Social Skills
2 28 (16.00%) Finance
3 11 (6.29%) Public Sector
4 10 (5.71%) Marketing
5 8 (4.57%) Analytical Skills
6 6 (3.43%) Aerospace
7 5 (2.86%) Organisational Skills
8 4 (2.29%) Games
8 4 (2.29%) Retail
9 3 (1.71%) Presentation Skills
9 3 (1.71%) Publishing
9 3 (1.71%) Telecoms
10 2 (1.14%) Agrochemical
10 2 (1.14%) Automotive
10 2 (1.14%) Banking
10 2 (1.14%) Electronics
10 2 (1.14%) Law
10 2 (1.14%) Manufacturing
10 2 (1.14%) Pharmaceutical
11 1 (0.57%) Advertising
Job Titles
1 42 (24.00%) Developer
2 38 (21.71%) Senior
3 31 (17.71%) DevOps Engineer
4 21 (12.00%) Data Engineer
5 15 (8.57%) PHP Developer
5 15 (8.57%) PHP Laravel Developer
6 14 (8.00%) AWS Engineer
7 13 (7.43%) Azure Developer
7 13 (7.43%) IT Engineer
8 12 (6.86%) Senior Developer
9 11 (6.29%) Java Developer
10 10 (5.71%) IT Support
10 10 (5.71%) IT Support Engineer
10 10 (5.71%) Lead
10 10 (5.71%) Support Engineer
11 9 (5.14%) AWS DevOps
11 9 (5.14%) AWS DevOps Engineer
12 8 (4.57%) JavaScript Developer
13 7 (4.00%) Java/J2EE Developer
13 7 (4.00%) Senior Java/J2EE Developer
Libraries, Frameworks & Software Standards
1 27 (15.43%) CSS
1 27 (15.43%) HTML
2 24 (13.71%) JSON
3 18 (10.29%) RabbitMQ
4 17 (9.71%) React
5 16 (9.14%) Elastic Stack
5 16 (9.14%) HTML5
6 15 (8.57%) Laravel
6 15 (8.57%) REST
6 15 (8.57%) Twitter Bootstrap
7 10 (5.71%) AngularJS
7 10 (5.71%) RESTful
7 10 (5.71%) Vue
8 8 (4.57%) GraphQL
8 8 (4.57%) J2EE
8 8 (4.57%) Node.js
9 7 (4.00%) jOOQ
9 7 (4.00%) Redux
9 7 (4.00%) Spring
9 7 (4.00%) Web Services
Miscellaneous
1 19 (10.86%) Distributed Systems
2 16 (9.14%) Self-Motivation
3 15 (8.57%) Public Cloud
4 13 (7.43%) Life Science
5 7 (4.00%) Cloud Native
5 7 (4.00%) Driving Licence
6 6 (3.43%) Genomics
6 6 (3.43%) Management Information System
7 5 (2.86%) Data Centre
7 5 (2.86%) IoT
8 4 (2.29%) Onboarding
8 4 (2.29%) Product Ownership
9 3 (1.71%) Algorithms
9 3 (1.71%) Enterprise Software
9 3 (1.71%) Greenfield Project
9 3 (1.71%) Mobile App
10 2 (1.14%) Cyber Defence
10 2 (1.14%) Cyber Threat
10 2 (1.14%) Data Structures
10 2 (1.14%) Security Posture
Operating Systems
1 48 (27.43%) Linux
2 19 (10.86%) Mac OS
3 17 (9.71%) Windows
4 10 (5.71%) Windows Server
5 4 (2.29%) Debian
5 4 (2.29%) Ubuntu
6 2 (1.14%) Windows Server 2012
6 2 (1.14%) Windows Server 2019
7 1 (0.57%) Unix
Processes & Methodologies
1 67 (38.29%) DevOps
2 38 (21.71%) Agile
3 36 (20.57%) CI/CD
4 35 (20.00%) Infrastructure as Code
5 32 (18.29%) Microservices
5 32 (18.29%) Problem-Solving
6 22 (12.57%) ETL
7 20 (11.43%) API Design
8 19 (10.86%) Continuous Delivery
9 17 (9.71%) Computer Science
9 17 (9.71%) Test Automation
10 15 (8.57%) API Development
10 15 (8.57%) Software Engineering
11 14 (8.00%) Analytics
11 14 (8.00%) Data Engineering
11 14 (8.00%) Deployment Automation
12 13 (7.43%) Containerisation
12 13 (7.43%) Customer Service
12 13 (7.43%) Cybersecurity
13 12 (6.86%) Continuous Improvement
Programming Languages
1 59 (33.71%) Python
2 47 (26.86%) SQL
3 40 (22.86%) JavaScript
4 37 (21.14%) Java
5 17 (9.71%) PHP
6 13 (7.43%) Perl
7 10 (5.71%) Groovy
7 10 (5.71%) Shell Script
8 8 (4.57%) Bash
9 6 (3.43%) TypeScript
10 4 (2.29%) C#
11 3 (1.71%) Go
11 3 (1.71%) PowerShell
11 3 (1.71%) Ruby
11 3 (1.71%) Scala
12 2 (1.14%) C
12 2 (1.14%) C++
12 2 (1.14%) R
13 1 (0.57%) PL/SQL
13 1 (0.57%) T-SQL
Qualifications
1 24 (13.71%) Degree
2 21 (12.00%) Security Cleared
3 18 (10.29%) SC Cleared
4 13 (7.43%) Computer Science Degree
5 5 (2.86%) CCNP
5 5 (2.86%) Cisco Certification
5 5 (2.86%) DBS Check
5 5 (2.86%) Master's Degree
6 3 (1.71%) AWS Certification
6 3 (1.71%) ISACA
6 3 (1.71%) Microsoft Certification
7 2 (1.14%) CISSP
8 1 (0.57%) CISA
8 1 (0.57%) CISM
8 1 (0.57%) CompTIA Security+
8 1 (0.57%) GIAC
8 1 (0.57%) MCSA
8 1 (0.57%) MCSE
8 1 (0.57%) RHCE
8 1 (0.57%) VMware Certified Professional (VCP)
Quality Assurance & Compliance
1 19 (10.86%) QA
2 7 (4.00%) ISO/IEC 27001
3 3 (1.71%) SLA
4 2 (1.14%) NIST
4 2 (1.14%) PMO
5 1 (0.57%) Cyber Essentials
5 1 (0.57%) GDPR
5 1 (0.57%) GxP
System Software
1 52 (29.71%) Docker
2 21 (12.00%) Active Directory
2 21 (12.00%) VMware Infrastructure
3 11 (6.29%) Hyper-V
4 4 (2.29%) vSphere
5 2 (1.14%) Embedded Firmware
5 2 (1.14%) Firmware
6 1 (0.57%) Ceph
6 1 (0.57%) Gluster
6 1 (0.57%) Virtual Desktop
Systems Management
1 50 (28.57%) Terraform
2 38 (21.71%) Kubernetes
3 34 (19.43%) Ansible
4 9 (5.14%) Packer
5 6 (3.43%) Fluentd
5 6 (3.43%) Kustomize
5 6 (3.43%) logstash
6 4 (2.29%) Nagios
6 4 (2.29%) Progress Chef
7 3 (1.71%) Grafana
7 3 (1.71%) Prometheus
7 3 (1.71%) Puppet
8 2 (1.14%) Istio
8 2 (1.14%) Kibana
9 1 (0.57%) DatAdvantage
9 1 (0.57%) FortiGate
9 1 (0.57%) ZABBIX
Vendors
1 28 (16.00%) Microsoft
2 24 (13.71%) VMware
3 14 (8.00%) AppDynamics
4 11 (6.29%) IBM
5 10 (5.71%) Google
6 8 (4.57%) Atlassian
7 7 (4.00%) Splunk
8 6 (3.43%) Cisco
8 6 (3.43%) SAP
9 5 (2.86%) Aruba
9 5 (2.86%) CheckPoint
9 5 (2.86%) F5
9 5 (2.86%) Oracle
10 4 (2.29%) Veeam
11 2 (1.14%) LogRhythm
11 2 (1.14%) New Relic
12 1 (0.57%) MuleSoft
12 1 (0.57%) Palantir
12 1 (0.57%) ServiceNow
12 1 (0.57%) Varonis