Legal Jobs in the North East

Legal
England > North East

The table below looks at the prevalence of the term Legal in permanent job vacancies advertised in the North East. Included is a benchmarking guide to the salaries offered in vacancies that have cited Legal over the 6 months to 26 April 2024 with a comparison to the same period over the previous 2 years.

6 months to
26 Apr 2024
Same period 2023 Same period 2022
Rank 40 82 107
Rank change year-on-year +42 +25 -22
Permanent jobs citing Legal 78 32 12
As % of all permanent jobs advertised in the North East 4.27% 2.51% 0.82%
As % of the General category 7.24% 4.05% 1.90%
Number of salaries quoted 44 8 5
10th Percentile £33,100 £49,325 £37,100
25th Percentile £43,438 £50,000 £38,000
Median annual salary (50th Percentile) £52,500 £60,000 £46,000
Median % change year-on-year -12.50% +30.43% +53.33%
75th Percentile £75,772 £72,625 £52,500
90th Percentile £83,759 £87,625 £55,500
England median annual salary £52,000 £55,000 £55,000
% change year-on-year -5.45% - -

All General Skills
North East

Legal is in the General Skills category. The following table is for comparison with the above and provides summary statistics for all permanent job vacancies advertised in the North East with a requirement for common skills.

Permanent vacancies with a requirement for common skills 1,077 790 630
As % of all permanent jobs advertised in the North East 58.98% 62.01% 42.92%
Number of salaries quoted 894 341 375
10th Percentile £26,500 £26,250 £26,250
25th Percentile £33,500 £33,788 £33,750
Median annual salary (50th Percentile) £47,234 £44,666 £45,000
Median % change year-on-year +5.75% -0.74% +5.88%
75th Percentile £62,500 £59,750 £57,500
90th Percentile £75,000 £77,500 £71,250
England median annual salary £52,500 £60,255 £60,000
% change year-on-year -12.87% +0.43% +4.35%

Legal
Job Vacancy Trend in the North East

Job postings citing Legal as a proportion of all IT jobs advertised in the North East.
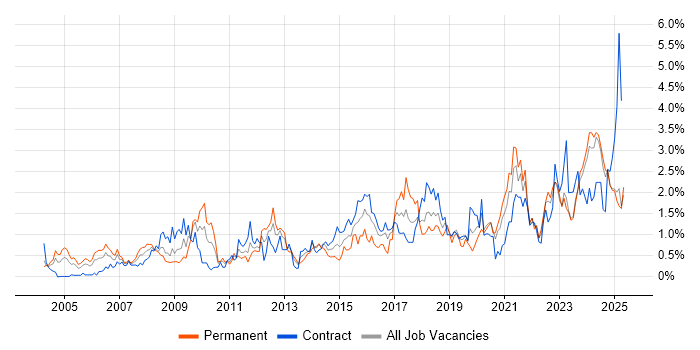
Job vacancy trend for Legal in the North East

Legal
Salary Trend in the North East

3-month moving average salary quoted in jobs citing Legal in the North East.

Salary trend for Legal in the North East

Legal
Salary Histogram in the North East

Salary distribution for jobs citing Legal in the North East over the 6 months to 26 April 2024.

Salary histogram for Legal in the North East

Legal
Job Locations in the North East

The table below looks at the demand and provides a guide to the median salaries quoted in IT jobs citing Legal within the North East region over the 6 months to 26 April 2024. The 'Rank Change' column provides an indication of the change in demand within each location based on the same 6 month period last year.

Location Rank Change
on Same Period
Last Year
Matching
Permanent
IT Job Ads
Median Salary
Past 6 Months
Median Salary
% Change
on Same Period
Last Year
Live
Jobs
Tyne and Wear +39 72 £57,500 -4.17% 19
Durham -4 2 £42,250 -11.52% 4
Northumberland -5 1 £30,000 - 1
Legal
England

Legal
Co-occurring Skills and Capabilities in the North East by Category

The follow tables expand on the table above by listing co-occurrences grouped by category. The same employment type, locality and period is covered with up to 20 co-occurrences shown in each of the following categories:

Application Platforms
1 7 (8.97%) SAS
1 7 (8.97%) SharePoint
Applications
1 9 (11.54%) Microsoft Project
2 8 (10.26%) Microsoft Excel
3 4 (5.13%) Microsoft Office
4 2 (2.56%) Microsoft PowerPoint
5 1 (1.28%) Spreadsheet
Business Applications
1 6 (7.69%) SAP HR
2 5 (6.41%) SAP HCM
2 5 (6.41%) SAP S/4HANA
3 4 (5.13%) SAP Payroll
4 1 (1.28%) SAP ERP
Cloud Services
1 16 (20.51%) Azure
2 15 (19.23%) Power Platform
3 9 (11.54%) Microsoft 365
4 8 (10.26%) PowerApps
5 7 (8.97%) Entra ID
5 7 (8.97%) SaaS
6 4 (5.13%) AWS
6 4 (5.13%) GCP
7 2 (2.56%) SuccessFactors
8 1 (1.28%) Dynamics 365
8 1 (1.28%) Power Automate
Communications & Networking
1 5 (6.41%) Firewall
2 1 (1.28%) DHCP
2 1 (1.28%) DNS
Database & Business Intelligence
1 10 (12.82%) Power BI
2 5 (6.41%) SQL Server
3 4 (5.13%) DB2
3 4 (5.13%) Relational Database
4 3 (3.85%) Metadata
5 2 (2.56%) Tableau
6 1 (1.28%) Base SAS
6 1 (1.28%) Big Data
6 1 (1.28%) BusinessObjects
6 1 (1.28%) Data Warehouse
Development Applications
1 6 (7.69%) JIRA
General
1 37 (47.44%) Finance
2 36 (46.15%) Social Skills
3 24 (30.77%) Banking
4 9 (11.54%) Analytical Skills
5 7 (8.97%) Law
6 6 (7.69%) Inclusion and Diversity
7 5 (6.41%) Financial Institution
8 4 (5.13%) Influencing Skills
8 4 (5.13%) Publishing
9 2 (2.56%) Electronics
9 2 (2.56%) Tech for Good
10 1 (1.28%) Games
10 1 (1.28%) Manufacturing
10 1 (1.28%) Marketing
10 1 (1.28%) Military
10 1 (1.28%) Presentation Skills
Job Titles
1 26 (33.33%) Senior
2 15 (19.23%) Analyst
3 11 (14.10%) Senior Manager
4 10 (12.82%) Project Manager
5 7 (8.97%) Applications Manager
5 7 (8.97%) IT Manager
5 7 (8.97%) Senior Analyst
6 6 (7.69%) Trainee
7 5 (6.41%) Security Analyst
7 5 (6.41%) Senior IT Manager
8 4 (5.13%) Architect
8 4 (5.13%) Lead
8 4 (5.13%) Lead Architect
8 4 (5.13%) Lead Solutions Architect
8 4 (5.13%) Product Manager
8 4 (5.13%) Senior Data Warehouse Specialist
8 4 (5.13%) Senior Product Manager
8 4 (5.13%) Solutions Architect
9 3 (3.85%) SAP HR Specialist
9 3 (3.85%) SAP HR/Payroll Specialist
Libraries, Frameworks & Software Standards
1 1 (1.28%) .NET
1 1 (1.28%) ASP.NET
1 1 (1.28%) CSS
1 1 (1.28%) HTML
1 1 (1.28%) JSON
Miscellaneous
1 9 (11.54%) SCADA
2 6 (7.69%) Credit Risk
2 6 (7.69%) Driving Licence
3 5 (6.41%) Low-Code
3 5 (6.41%) Management Information System
4 4 (5.13%) Public Cloud
5 2 (2.56%) Algorithms
5 2 (2.56%) iPad
5 2 (2.56%) NHS
5 2 (2.56%) Onboarding
6 1 (1.28%) Life Science
6 1 (1.28%) Product Ownership
6 1 (1.28%) Renewable Energy
6 1 (1.28%) Social Media
Operating Systems
1 6 (7.69%) Windows
2 5 (6.41%) Windows 10
2 5 (6.41%) Windows Server
3 1 (1.28%) Windows Server 2016
Processes & Methodologies
1 21 (26.92%) Agile
2 17 (21.79%) Coaching
2 17 (21.79%) Risk Management
3 16 (20.51%) Business Intelligence
3 16 (20.51%) Data Management
4 15 (19.23%) Process Improvement
5 12 (15.38%) Data Governance
5 12 (15.38%) Data Privacy
5 12 (15.38%) Data Protection
5 12 (15.38%) Matrix Management
5 12 (15.38%) Matrix Organization
6 11 (14.10%) Roadmaps
7 10 (12.82%) Document Management
7 10 (12.82%) Mentoring
7 10 (12.82%) Product Management
7 10 (12.82%) Product Roadmap
8 9 (11.54%) Budgeting
8 9 (11.54%) Gantt Chart
9 8 (10.26%) Line Management
9 8 (10.26%) Stakeholder Management
Programming Languages
1 14 (17.95%) SQL
2 3 (3.85%) Python
2 3 (3.85%) R
3 2 (2.56%) Java
4 1 (1.28%) C#
4 1 (1.28%) JavaScript
Qualifications
1 7 (8.97%) Degree
2 3 (3.85%) Master's Degree
2 3 (3.85%) PhD
3 1 (1.28%) (ISC)2 CCSP
3 1 (1.28%) CCSP
3 1 (1.28%) Cisco Certification
3 1 (1.28%) CISM
3 1 (1.28%) CISSP
3 1 (1.28%) CompTIA Security+
3 1 (1.28%) Computer Science Degree
3 1 (1.28%) GSEC
3 1 (1.28%) Security Cleared
3 1 (1.28%) SSCP
Quality Assurance & Compliance
1 17 (21.79%) GDPR
2 7 (8.97%) Cyber Essentials
2 7 (8.97%) ISO/IEC 27001
3 6 (7.69%) Data Quality
4 5 (6.41%) NIST
5 4 (5.13%) IFRS
5 4 (5.13%) IFRS 9
6 2 (2.56%) Cyber Essentials PLUS
6 2 (2.56%) GLP
6 2 (2.56%) Good Clinical Practice
System Software
1 7 (8.97%) Active Directory
Systems Management
1 4 (5.13%) Single Sign-On
2 1 (1.28%) Microsoft Intune
2 1 (1.28%) vCenter Server
Vendors
1 16 (20.51%) Microsoft
2 6 (7.69%) iManage
2 6 (7.69%) SAP
3 5 (6.41%) Automation Anywhere
4 4 (5.13%) Google
4 4 (5.13%) IBM
4 4 (5.13%) Oracle
5 2 (2.56%) Concur
6 1 (1.28%) CrowdStrike
6 1 (1.28%) Intel
6 1 (1.28%) VMware