Azure Jobs in the North East

Microsoft Azure
England > North East

The table below provides summary statistics for permanent job vacancies advertised in the North East requiring Azure skills. It includes a benchmarking guide to the annual salaries offered in vacancies that cited Azure over the 6 months leading up to 18 July 2025, comparing them to the same period in the previous two years.

6 months to
18 Jul 2025
Same period 2024 Same period 2023
Rank 10 2 8
Rank change year-on-year -8 +6 -2
Permanent jobs citing Azure 148 350 170
As % of all permanent jobs advertised in the North East 9.51% 18.36% 16.36%
As % of the Cloud Services category 71.50% 54.43% 46.96%
Number of salaries quoted 100 284 140
10th Percentile £25,000 £29,825 £36,125
25th Percentile £31,900 £36,250 £47,672
Median annual salary (50th Percentile) £50,000 £50,000 £56,250
Median % change year-on-year - -11.11% +25.00%
75th Percentile £65,625 £67,500 £68,037
90th Percentile £72,676 £72,347 £78,200
England median annual salary £60,000 £60,000 £63,875
% change year-on-year - -6.07% +2.20%

All Cloud Skills
North East

Azure falls under the Cloud Services category. For comparison with the information above, the following table provides summary statistics for all permanent job vacancies requiring cloud computing skills in the North East.

Permanent vacancies with a requirement for cloud computing skills 207 643 362
As % of all permanent jobs advertised in the North East 13.30% 33.74% 34.84%
Number of salaries quoted 137 504 251
10th Percentile £25,300 £26,975 £31,250
25th Percentile £32,000 £33,500 £40,000
Median annual salary (50th Percentile) £51,250 £50,000 £55,000
Median % change year-on-year +2.50% -9.09% +10.00%
75th Percentile £67,500 £67,968 £67,500
90th Percentile £80,000 £77,500 £77,500
England median annual salary £60,000 £58,700 £65,000
% change year-on-year +2.21% -9.69% +4.00%

Azure
Job Vacancy Trend in the North East

Job postings citing Azure as a proportion of all IT jobs advertised in the North East.
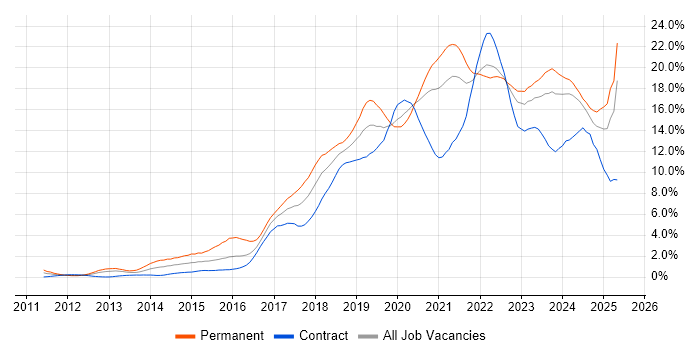
Job vacancy trend for Azure in the North East

Azure
Salary Trend in the North East

3-month moving average salary quoted in jobs citing Azure in the North East.

Salary trend for Azure in the North East

Azure
Salary Histogram in the North East

Salary distribution for jobs citing Azure in the North East over the 6 months to 18 July 2025.

Salary histogram for Azure in the North East

Azure
Job Locations in the North East

The table below looks at the demand and provides a guide to the median salaries quoted in IT jobs citing Azure within the North East region over the 6 months to 18 July 2025. The 'Rank Change' column provides an indication of the change in demand within each location based on the same 6 month period last year.

Location Rank Change
on Same Period
Last Year
Matching
Permanent
IT Job Ads
Median Salary
Past 6 Months
Median Salary
% Change
on Same Period
Last Year
Live
Jobs
Tyne and Wear -6 108 £52,500 +5.00% 95
Durham -15 34 £43,500 -20.91% 21
Northumberland +4 5 £37,500 -40.48% 3
Azure
England

Azure
Co-occurring Skills and Capabilities in the North East by Category

The follow tables expand on the table above by listing co-occurrences grouped by category. The same employment type, locality and period is covered with up to 20 co-occurrences shown in each of the following categories:

Application Platforms
1 16 (10.81%) Microsoft Exchange
2 7 (4.73%) SharePoint
3 5 (3.38%) Apache Spark
4 3 (2.03%) Apache Airflow
4 3 (2.03%) Confluence
4 3 (2.03%) SAS
5 2 (1.35%) Apache
Applications
1 1 (0.68%) Microsoft Project
Business Applications
1 1 (0.68%) Visualfiles
Cloud Services
1 37 (25.00%) AWS
2 34 (22.97%) Entra ID
3 31 (20.95%) Microsoft 365
4 13 (8.78%) Power Platform
5 12 (8.11%) GCP
5 12 (8.11%) GitHub
6 11 (7.43%) OCI
7 7 (4.73%) Azure DevOps
8 6 (4.05%) SaaS
9 5 (3.38%) Dynamics 365
10 4 (2.70%) Azure Data Factory
10 4 (2.70%) GitHub Actions
11 3 (2.03%) Amazon ECR
11 3 (2.03%) Amazon ECS
11 3 (2.03%) Amazon OpenSearch
11 3 (2.03%) AWS CloudFormation
11 3 (2.03%) AWS CodeBuild
11 3 (2.03%) dbt
11 3 (2.03%) Pulumi
11 3 (2.03%) Sentry
Communications & Networking
1 17 (11.49%) Firewall
2 14 (9.46%) VLAN
3 10 (6.76%) TCP/IP
3 10 (6.76%) Wireless
4 7 (4.73%) SAN
4 7 (4.73%) WAN
5 6 (4.05%) VPN
6 5 (3.38%) DHCP
6 5 (3.38%) DNS
6 5 (3.38%) LAN
6 5 (3.38%) Network Security
7 3 (2.03%) PuTTY
8 2 (1.35%) Internet
8 2 (1.35%) NAS
8 2 (1.35%) Unified Communications
9 1 (0.68%) Broadband
9 1 (0.68%) VoIP
9 1 (0.68%) Wi-Fi
Database & Business Intelligence
1 33 (22.30%) SQL Server
2 12 (8.11%) MySQL
3 10 (6.76%) Amazon RDS
3 10 (6.76%) PostgreSQL
4 8 (5.41%) Power BI
5 7 (4.73%) Azure SQL Database
5 7 (4.73%) MongoDB
6 4 (2.70%) Data Warehouse
6 4 (2.70%) Elasticsearch
6 4 (2.70%) Metadata
7 3 (2.03%) Amazon Athena
7 3 (2.03%) BigQuery
7 3 (2.03%) BusinessObjects
7 3 (2.03%) Data Lake
7 3 (2.03%) Impala
7 3 (2.03%) Metadata Repository
7 3 (2.03%) Qlik Sense
7 3 (2.03%) RDBMS
7 3 (2.03%) Relational Database
7 3 (2.03%) Spark SQL
Development Applications
1 9 (6.08%) Bitbucket
2 6 (4.05%) Git
2 6 (4.05%) JIRA
2 6 (4.05%) SonarQube
3 5 (3.38%) Selenium
4 3 (2.03%) Artifactory
4 3 (2.03%) Cucumber
4 3 (2.03%) GitLab
4 3 (2.03%) Maven
4 3 (2.03%) Octopus Deploy
4 3 (2.03%) Sonatype Nexus
4 3 (2.03%) TeamCity
5 2 (1.35%) NUnit
5 2 (1.35%) SpecFlow
5 2 (1.35%) Visual Studio
6 1 (0.68%) Jasmine
6 1 (0.68%) Karma Test Runner
6 1 (0.68%) Protractor
General
1 46 (31.08%) Social Skills
2 29 (19.59%) Finance
3 11 (7.43%) Analytical Skills
4 7 (4.73%) Inclusion and Diversity
5 6 (4.05%) Advertising
6 5 (3.38%) Retail
7 4 (2.70%) Public Sector
8 3 (2.03%) Banking
8 3 (2.03%) Law
9 2 (1.35%) Corporate Banking
9 2 (1.35%) Front Office
9 2 (1.35%) Investment Banking
9 2 (1.35%) Legal
10 1 (0.68%) Electronics
10 1 (0.68%) Manufacturing
10 1 (0.68%) Pharmaceutical
Job Titles
1 30 (20.27%) Identity Management Specialist
1 30 (20.27%) Technology Specialist
2 24 (16.22%) Senior
3 17 (11.49%) Developer
4 16 (10.81%) Software Engineer
5 13 (8.78%) Analyst
5 13 (8.78%) Architect
6 10 (6.76%) Support Analyst
7 8 (5.41%) IT Analyst
7 8 (5.41%) IT Support
7 8 (5.41%) Support Engineer
7 8 (5.41%) Technical Engineer
8 7 (4.73%) 2nd Line Support
8 7 (4.73%) Cloud Architect
8 7 (4.73%) Data Engineer
8 7 (4.73%) IT Support Analyst
8 7 (4.73%) Senior Software Engineer
8 7 (4.73%) Solutions Architect
8 7 (4.73%) Technical Support
8 7 (4.73%) Technical Support Engineer
Libraries, Frameworks & Software Standards
1 28 (18.92%) .NET
2 11 (7.43%) AngularJS
2 11 (7.43%) CSS
3 7 (4.73%) ASP.NET
4 6 (4.05%) jQuery
4 6 (4.05%) Kafka
5 5 (3.38%) .NET Framework
5 5 (3.38%) 802.1X
5 5 (3.38%) HTML
5 5 (3.38%) React
5 5 (3.38%) REST
6 4 (2.70%) Jest
6 4 (2.70%) Node.js
6 4 (2.70%) PySpark
7 3 (2.03%) Apache NiFi
7 3 (2.03%) Django
7 3 (2.03%) JPA
7 3 (2.03%) Regular Expression
7 3 (2.03%) RESTful
7 3 (2.03%) Spring
Miscellaneous
1 30 (20.27%) NHS
2 11 (7.43%) Operational Technology
3 8 (5.41%) Greenfield Project
4 7 (4.73%) Renewable Energy
5 6 (4.05%) Data Centre
5 6 (4.05%) SCADA
6 5 (3.38%) Product Ownership
7 4 (2.70%) Clustering
7 4 (2.70%) Enterprise Software
8 3 (2.03%) Distributed Systems
9 2 (1.35%) Cloud Native
9 2 (1.35%) Housing Association
10 1 (0.68%) Analytical Mindset
10 1 (0.68%) Driving Licence
10 1 (0.68%) Hedge funds
10 1 (0.68%) Management Information System
10 1 (0.68%) Self-Motivation
10 1 (0.68%) Virtual Team
Operating Systems
1 31 (20.95%) Windows
2 14 (9.46%) Windows Server
3 13 (8.78%) Linux
4 6 (4.05%) Unix
5 3 (2.03%) Mac OS
6 2 (1.35%) Windows 10
7 1 (0.68%) Windows Server 2016
Processes & Methodologies
1 40 (27.03%) Agile
2 37 (25.00%) Problem-Solving
3 35 (23.65%) ITIL
4 34 (22.97%) DevOps
5 30 (20.27%) Identity Management
6 22 (14.86%) CI/CD
7 21 (14.19%) Software Engineering
8 18 (12.16%) Customer Service
9 14 (9.46%) Mentoring
10 12 (8.11%) Computer Science
10 12 (8.11%) Continuous Improvement
10 12 (8.11%) Full-Stack Development
11 11 (7.43%) Collaborative Working
11 11 (7.43%) TOGAF
12 10 (6.76%) OO
13 9 (6.08%) ETL
13 9 (6.08%) High Availability
13 9 (6.08%) User Experience
14 8 (5.41%) Customer-Centricity
14 8 (5.41%) Fintech
Programming Languages
1 36 (24.32%) SQL
2 24 (16.22%) Python
3 23 (15.54%) C#
3 23 (15.54%) Java
4 15 (10.14%) TypeScript
5 10 (6.76%) PowerShell
6 6 (4.05%) C++
6 6 (4.05%) JavaScript
6 6 (4.05%) PHP
6 6 (4.05%) T-SQL
7 4 (2.70%) Bash
7 4 (2.70%) R
8 3 (2.03%) PROC SQL
9 2 (1.35%) C
9 2 (1.35%) Progress 4GL
10 1 (0.68%) Bicep
10 1 (0.68%) Data Analysis Expressions
10 1 (0.68%) VB.NET
10 1 (0.68%) VBScript
Qualifications
1 53 (35.81%) Degree
2 37 (25.00%) DBS Check
3 11 (7.43%) TOGAF Certification
4 10 (6.76%) Computer Science Degree
5 5 (3.38%) CCNA
5 5 (3.38%) Cisco Certification
6 4 (2.70%) Azure Certification
6 4 (2.70%) CCNP
6 4 (2.70%) SC Cleared
6 4 (2.70%) Security Cleared
7 3 (2.03%) AWS Certification
7 3 (2.03%) Microsoft Certification
8 1 (0.68%) CISM
8 1 (0.68%) CISSP
8 1 (0.68%) MCSA
8 1 (0.68%) MCSE
8 1 (0.68%) PhD
8 1 (0.68%) PMI Certification
8 1 (0.68%) PMP
8 1 (0.68%) VMware Certified Professional (VCP)
Quality Assurance & Compliance
1 9 (6.08%) QA
2 7 (4.73%) Data Quality
3 4 (2.70%) ISO/IEC 27001
3 4 (2.70%) PCI DSS
3 4 (2.70%) SOC 2
4 3 (2.03%) Accessibility
5 1 (0.68%) PMO
System Software
1 59 (39.86%) Active Directory
2 19 (12.84%) VMware Infrastructure
3 14 (9.46%) Hyper-V
4 10 (6.76%) Docker
5 6 (4.05%) Virtual Machines
6 4 (2.70%) vSphere
7 3 (2.03%) Apache Flume
7 3 (2.03%) HDFS
Systems Management
1 19 (12.84%) Terraform
2 12 (8.11%) Kubernetes
3 11 (7.43%) Microsoft Intune
4 7 (4.73%) FortiGate
5 3 (2.03%) Ansible
5 3 (2.03%) AWS Copilot
5 3 (2.03%) Control-M
5 3 (2.03%) Docker Swarm
5 3 (2.03%) Grafana
5 3 (2.03%) Kibana
5 3 (2.03%) logstash
5 3 (2.03%) Oozie
6 1 (0.68%) SCCM
Vendors
1 82 (55.41%) Microsoft
2 25 (16.89%) VMware
3 15 (10.14%) Cisco
4 12 (8.11%) Oracle
5 8 (5.41%) Veeam
6 7 (4.73%) SonicWALL
6 7 (4.73%) WatchGuard
7 6 (4.05%) CheckPoint
7 6 (4.05%) Databricks
7 6 (4.05%) Informatica
7 6 (4.05%) Meraki
8 5 (3.38%) Google
9 4 (2.70%) SAP
10 3 (2.03%) Atlassian
10 3 (2.03%) MicroStrategy
10 3 (2.03%) RedGate
10 3 (2.03%) Solace
10 3 (2.03%) Talend
11 2 (1.35%) Capita
11 2 (1.35%) Nimble Storage