Legal Jobs in England

Legal
UK > England

The table below looks at the prevalence of the term Legal in permanent job vacancies in England. Included is a benchmarking guide to the salaries offered in vacancies that cited Legal over the 6 months leading up to 26 July 2024, comparing them to the same period in the previous two years.

6 months to
26 Jul 2024
Same period 2023 Same period 2022
Rank 56 122 90
Rank change year-on-year +66 -32 +73
Permanent jobs citing Legal 2,967 2,011 5,396
As % of all permanent jobs advertised in England 3.79% 2.83% 3.67%
As % of the General category 6.62% 4.29% 5.44%
Number of salaries quoted 1,319 1,299 1,946
10th Percentile £29,000 £31,250 £31,000
25th Percentile £35,000 £41,250 £41,250
Median annual salary (50th Percentile) £50,000 £55,000 £55,000
Median % change year-on-year -9.09% - +4.76%
75th Percentile £72,000 £73,875 £75,000
90th Percentile £90,000 £90,000 £95,000
UK median annual salary £50,000 £55,000 £55,000
% change year-on-year -9.09% - +4.76%

All General Skills
England

Legal falls under the General Skills category. For comparison with the information above, the following table provides summary statistics for all permanent job vacancies requiring common skills in England.

Permanent vacancies with a requirement for common skills 44,799 46,891 99,241
As % of all permanent jobs advertised in England 57.17% 65.97% 67.50%
Number of salaries quoted 28,228 29,742 48,838
10th Percentile £28,500 £32,000 £32,500
25th Percentile £37,500 £43,250 £43,500
Median annual salary (50th Percentile) £55,000 £60,000 £60,000
Median % change year-on-year -8.33% - +4.35%
75th Percentile £73,886 £82,500 £80,000
90th Percentile £95,000 £105,000 £100,000
UK median annual salary £54,000 £60,000 £60,000
% change year-on-year -10.00% - +6.19%

Legal
Job Vacancy Trend in England

Job postings citing Legal as a proportion of all IT jobs advertised in England.
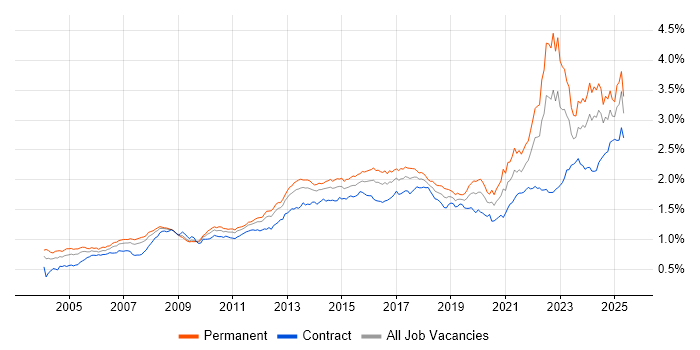
Job vacancy trend for Legal in England

Legal
Salary Trend in England

3-month moving average salary quoted in jobs citing Legal in England.

Salary trend for Legal in England

Legal
Salary Histogram in England

Salary distribution for jobs citing Legal in England over the 6 months to 26 July 2024.

Salary histogram for Legal in England

Legal
Job Locations in England

The table below looks at the demand and provides a guide to the median salaries quoted in IT jobs citing Legal within the England region over the 6 months to 26 July 2024. The 'Rank Change' column provides an indication of the change in demand within each location based on the same 6 month period last year.

Location Rank Change
on Same Period
Last Year
Matching
Permanent
IT Job Ads
Median Salary
Past 6 Months
Median Salary
% Change
on Same Period
Last Year
Live
Jobs
London +58 1,010 £65,000 +1.56% 272
North of England +90 622 £46,500 -2.11% 190
Midlands +51 455 £47,000 -10.48% 135
South East +18 421 £40,000 -23.08% 186
North West +86 378 £45,000 -5.26% 122
South West +43 280 £49,000 +3.16% 124
West Midlands +8 257 £47,000 -10.48% 83
East Midlands +108 198 £45,000 +38.46% 52
Yorkshire +57 179 £45,000 -5.26% 49
East of England +15 156 £50,000 -19.03% 63
North East +43 65 £52,500 -4.55% 24
Legal
UK

Legal
Co-occurring Skills and Capabilities in England by Category

The follow tables expand on the table above by listing co-occurrences grouped by category. The same employment type, locality and period is covered with up to 20 co-occurrences shown in each of the following categories:

Application Platforms
1 164 (5.53%) SharePoint
2 87 (2.93%) SAS
3 79 (2.66%) Microsoft Exchange
4 21 (0.71%) CMS
5 8 (0.27%) Apache Spark
6 7 (0.24%) IIS
7 6 (0.20%) Oracle Workflow
8 5 (0.17%) Confluence
9 4 (0.13%) Apache
9 4 (0.13%) Apache Pulsar
9 4 (0.13%) Office Communications Server
10 3 (0.10%) Drupal
10 3 (0.10%) nginx
11 2 (0.067%) BizTalk Server
11 2 (0.067%) Exchange Server 2013
11 2 (0.067%) WordPress
12 1 (0.034%) Documentum
12 1 (0.034%) WebSphere
Applications
1 450 (15.17%) Microsoft Excel
2 442 (14.90%) Microsoft Office
3 130 (4.38%) Microsoft PowerPoint
4 75 (2.53%) AutoCAD
5 19 (0.64%) Spreadsheet
6 18 (0.61%) Microsoft Project
6 18 (0.61%) Revit
7 15 (0.51%) MS Visio
8 8 (0.27%) SPSS
9 6 (0.20%) Simulink
9 6 (0.20%) Stateflow
10 5 (0.17%) SketchUp
10 5 (0.17%) SOLIDWORKS
11 4 (0.13%) Chatbot
12 3 (0.10%) Adobe Creative Suite
13 2 (0.067%) FileZilla
14 1 (0.034%) Camtasia
14 1 (0.034%) InVision
14 1 (0.034%) Sketch
14 1 (0.034%) Zeplin
Business Applications
1 46 (1.55%) Dynamics CRM
2 44 (1.48%) Ripple
3 41 (1.38%) iTrent
4 36 (1.21%) Elite 3E
5 13 (0.44%) Oracle ERP
6 11 (0.37%) Relativity
6 11 (0.37%) ResourceLink
7 10 (0.34%) Infor SunSystems
7 10 (0.34%) SAP HR
7 10 (0.34%) SAP Payroll
8 8 (0.27%) Oracle EBS
8 8 (0.27%) PeopleSoft HCM
8 8 (0.27%) SAP S/4HANA
9 7 (0.24%) BPCS
9 7 (0.24%) NEC Housing
10 6 (0.20%) NetSuite
10 6 (0.20%) Oracle Applications
11 5 (0.17%) Primavera
11 5 (0.17%) SAP ERP
12 4 (0.13%) Visualfiles
Cloud Services
1 329 (11.09%) Azure
2 210 (7.08%) Microsoft 365
3 197 (6.64%) Power Platform
4 135 (4.55%) AWS
5 112 (3.77%) Entra ID
6 82 (2.76%) GCP
7 78 (2.63%) SaaS
8 61 (2.06%) Dynamics 365
9 43 (1.45%) SuccessFactors
10 39 (1.31%) PowerApps
11 35 (1.18%) Azure DevOps
12 31 (1.04%) PaaS
13 28 (0.94%) OneDrive
14 21 (0.71%) Power Automate
15 20 (0.67%) GitHub
16 18 (0.61%) OCI
17 17 (0.57%) Azure Data Factory
18 14 (0.47%) Azure Synapse Analytics
18 14 (0.47%) IaaS
19 11 (0.37%) Azure Cosmos DB
Communications & Networking
1 77 (2.60%) Firewall
2 48 (1.62%) Internet
3 34 (1.15%) LAN
3 34 (1.15%) WAN
4 27 (0.91%) Wireless
5 22 (0.74%) Intranet
6 21 (0.71%) TCP/IP
7 20 (0.67%) Wi-Fi
8 17 (0.57%) Intrusion Detection
8 17 (0.57%) Network Security
9 15 (0.51%) VPN
10 14 (0.47%) DHCP
11 12 (0.40%) DNS
12 10 (0.34%) SAN
13 9 (0.30%) 4G
13 9 (0.30%) DSL
13 9 (0.30%) LTE
13 9 (0.30%) SD-WAN
13 9 (0.30%) WebEx
14 8 (0.27%) Skype
Database & Business Intelligence
1 166 (5.59%) Power BI
2 92 (3.10%) SQL Server
3 43 (1.45%) Tableau
4 38 (1.28%) Relational Database
5 29 (0.98%) SQL Server Reporting Services
6 26 (0.88%) Data Warehouse
7 21 (0.71%) BusinessObjects
8 19 (0.64%) Data Lake
8 19 (0.64%) DynamoDB
8 19 (0.64%) PostgreSQL
9 18 (0.61%) Amazon RDS
9 18 (0.61%) MySQL
10 16 (0.54%) Amazon Aurora
11 14 (0.47%) Big Data
12 13 (0.44%) Metadata
13 12 (0.40%) DB2
13 12 (0.40%) EDRMS
13 12 (0.40%) MS Access
13 12 (0.40%) NoSQL
14 10 (0.34%) SQL Server Integration Services
Development Applications
1 82 (2.76%) JIRA
2 31 (1.04%) Git
3 13 (0.44%) Visual Studio
4 9 (0.30%) Jenkins
5 8 (0.27%) GitLab
6 7 (0.24%) Cypress.io
7 6 (0.20%) Oracle Forms
8 5 (0.17%) CircleCI
8 5 (0.17%) Eclipse
8 5 (0.17%) fastlane
8 5 (0.17%) Selenium
9 3 (0.10%) Axure RP
9 3 (0.10%) LoadRunner
9 3 (0.10%) NeoLoad
9 3 (0.10%) WebDriver
10 2 (0.067%) Atlassian Bamboo
10 2 (0.067%) Cucumber
10 2 (0.067%) JUnit
10 2 (0.067%) SoapUI
10 2 (0.067%) TestNG
General
1 1,195 (40.28%) Finance
2 1,068 (36.00%) Social Skills
3 540 (18.20%) Law
4 460 (15.50%) Analytical Skills
5 433 (14.59%) Retail
6 405 (13.65%) Inclusion and Diversity
7 356 (12.00%) Banking
8 194 (6.54%) Marketing
9 99 (3.34%) Manufacturing
10 91 (3.07%) Organisational Skills
11 78 (2.63%) Financial Institution
11 78 (2.63%) Public Sector
12 77 (2.60%) Local Government
13 75 (2.53%) Influencing Skills
14 57 (1.92%) Publishing
14 57 (1.92%) Telecoms
15 46 (1.55%) Presentation Skills
16 41 (1.38%) Investment Banking
17 37 (1.25%) Automotive
18 27 (0.91%) Games
Job Titles
1 720 (24.27%) Analyst
2 504 (16.99%) Senior
3 213 (7.18%) Senior Analyst
4 212 (7.15%) Lead
5 187 (6.30%) Developer
6 136 (4.58%) Project Manager
7 127 (4.28%) IT Manager
8 114 (3.84%) Software Engineer
9 110 (3.71%) Business Analyst
10 107 (3.61%) Development Manager
11 95 (3.20%) Business Manager
12 84 (2.83%) Business Development Manager
13 80 (2.70%) Financial Analyst
14 68 (2.29%) Architect
14 68 (2.29%) Coordinator
15 61 (2.06%) IT Support
16 53 (1.79%) Senior Manager
16 53 (1.79%) Systems Analyst
17 52 (1.75%) Support Analyst
18 51 (1.72%) Administrator
Libraries, Frameworks & Software Standards
1 108 (3.64%) HTML
2 98 (3.30%) .NET
3 77 (2.60%) CSS
3 77 (2.60%) React
4 36 (1.21%) Spring
5 30 (1.01%) AngularJS
6 26 (0.88%) REST
7 25 (0.84%) JSON
8 24 (0.81%) .NET Framework
8 24 (0.81%) ASP.NET
9 22 (0.74%) XML
10 20 (0.67%) RESTful
11 19 (0.64%) PySpark
12 18 (0.61%) SOAP
13 16 (0.54%) Blazor
13 16 (0.54%) Oracle Fusion
13 16 (0.54%) Vue
13 16 (0.54%) Web Services
14 14 (0.47%) Swagger
15 13 (0.44%) .NET Core
Miscellaneous
1 234 (7.89%) Management Information System
2 116 (3.91%) Driving Licence
3 94 (3.17%) Onboarding
4 69 (2.33%) Housing Association
4 69 (2.33%) Self-Motivation
5 59 (1.99%) Credit Risk
6 57 (1.92%) Cloud Native
7 52 (1.75%) Algorithms
7 52 (1.75%) Blockchain
8 46 (1.55%) Product Ownership
9 43 (1.45%) Data Structures
10 38 (1.28%) Security Posture
11 37 (1.25%) Data Centre
12 30 (1.01%) NFT
12 30 (1.01%) Public Cloud
13 29 (0.98%) Distributed Systems
13 29 (0.98%) Enterprise Software
14 27 (0.91%) Data Protection Act
15 25 (0.84%) Foreign Exchange (FX)
15 25 (0.84%) Renewable Energy
Operating Systems
1 183 (6.17%) Windows
2 78 (2.63%) Windows 10
3 50 (1.69%) Android
3 50 (1.69%) Windows Server
4 41 (1.38%) Apple iOS
5 19 (0.64%) Linux
6 7 (0.24%) Mac OS
6 7 (0.24%) VMS
7 5 (0.17%) Windows 8
8 4 (0.13%) Oracle Linux
8 4 (0.13%) Windows Server 2016
8 4 (0.13%) Windows Vista
9 3 (0.10%) Unix
9 3 (0.10%) Windows Server 2008
9 3 (0.10%) Windows Server 2012
10 2 (0.067%) Mac OS X
10 2 (0.067%) Windows Server 2019
Processes & Methodologies
1 599 (20.19%) Agile
2 478 (16.11%) Problem-Solving
3 383 (12.91%) Coaching
4 360 (12.13%) Continuous Improvement
5 354 (11.93%) Logistics
6 345 (11.63%) Risk Management
7 321 (10.82%) Project Management
8 315 (10.62%) Decision-Making
9 272 (9.17%) Process Improvement
10 255 (8.59%) Information Security
11 244 (8.22%) Data Management
12 241 (8.12%) Time Management
13 239 (8.06%) Data Protection
13 239 (8.06%) ITIL
14 236 (7.95%) Analytics
15 224 (7.55%) Mentoring
16 220 (7.41%) Customer Service
17 216 (7.28%) Business Intelligence
18 215 (7.25%) Cybersecurity
19 212 (7.15%) Data Analysis
Programming Languages
1 343 (11.56%) SQL
2 184 (6.20%) Python
3 138 (4.65%) JavaScript
4 105 (3.54%) Java
5 94 (3.17%) C#
6 85 (2.86%) PowerShell
7 54 (1.82%) TypeScript
8 45 (1.52%) Go
9 36 (1.21%) VBA
10 31 (1.04%) Rust
11 30 (1.01%) Solidity
12 29 (0.98%) T-SQL
13 26 (0.88%) C++
14 23 (0.78%) Kotlin
15 18 (0.61%) Scala
16 17 (0.57%) Ruby
17 14 (0.47%) MATLAB
18 13 (0.44%) R
19 12 (0.40%) PHP
20 11 (0.37%) VB.NET
Qualifications
1 691 (23.29%) Degree
2 111 (3.74%) HNC
3 78 (2.63%) HND
4 67 (2.26%) CISSP
4 67 (2.26%) Master's Degree
5 51 (1.72%) Computer Science Degree
6 45 (1.52%) APMG
7 41 (1.38%) Security Cleared
8 40 (1.35%) CISM
8 40 (1.35%) DBS Check
9 39 (1.31%) CIPD
9 39 (1.31%) CISA
10 31 (1.04%) ACCA
11 28 (0.94%) Microsoft Certification
12 20 (0.67%) CIMA
12 20 (0.67%) Cisco Certification
12 20 (0.67%) ITIL Certification
13 18 (0.61%) PhD
13 18 (0.61%) SC Cleared
14 17 (0.57%) MBA
Quality Assurance & Compliance
1 253 (8.53%) GDPR
2 233 (7.85%) QA
3 128 (4.31%) ISO/IEC 27001
4 108 (3.64%) Data Quality
5 57 (1.92%) SLA
6 53 (1.79%) NIST
7 51 (1.72%) IFRS
8 43 (1.45%) GRC
9 36 (1.21%) IFRS 9
10 35 (1.18%) Cyber Essentials
11 32 (1.08%) Sarbanes-Oxley
12 28 (0.94%) ISO 9001
12 28 (0.94%) PMO
13 26 (0.88%) ISO 22301
14 25 (0.84%) PCI DSS
15 22 (0.74%) GAAP
16 21 (0.71%) NEBOSH
17 20 (0.67%) Accessibility
18 13 (0.44%) Cyber Essentials PLUS
18 13 (0.44%) ISO 14001
System Software
1 169 (5.70%) Active Directory
2 46 (1.55%) Docker
3 45 (1.52%) RACF
4 35 (1.18%) Hyper-V
5 30 (1.01%) VMware Infrastructure
6 9 (0.30%) Firmware
7 5 (0.17%) VMware ESXi
8 4 (0.13%) Virtual Desktop
8 4 (0.13%) Virtual Servers
9 3 (0.10%) Terminal Services
9 3 (0.10%) XenApp
10 2 (0.067%) Virtual Machines
11 1 (0.034%) Microsoft Virtual Server
11 1 (0.034%) vSphere
11 1 (0.034%) XenDesktop
Systems Management
1 73 (2.46%) Kubernetes
2 24 (0.81%) Microsoft Intune
3 21 (0.71%) SCCM
4 17 (0.57%) Terraform
5 14 (0.47%) Ansible
6 13 (0.44%) SCOM
7 11 (0.37%) Functional Safety
8 7 (0.24%) FortiGate
8 7 (0.24%) Single Sign-On
9 3 (0.10%) Active Directory Federation Services
9 3 (0.10%) AirWatch
9 3 (0.10%) Istio
9 3 (0.10%) QRadar
10 2 (0.067%) Argo
10 2 (0.067%) Jamf Pro
10 2 (0.067%) Progress Chef
10 2 (0.067%) Puppet
11 1 (0.034%) Control-M
11 1 (0.034%) Oracle Identity Management
11 1 (0.034%) SCOrch
Vendors
1 800 (26.96%) Microsoft
2 149 (5.02%) SAP
3 70 (2.36%) iManage
4 62 (2.09%) Oracle
5 52 (1.75%) Citrix
6 50 (1.69%) VMware
7 45 (1.52%) CyberArk
8 42 (1.42%) Intapp
9 40 (1.35%) Google
10 39 (1.31%) ServiceNow
11 37 (1.25%) Cisco
12 34 (1.15%) IBM
13 25 (0.84%) NCR
14 23 (0.78%) Salesforce
15 22 (0.74%) Alteryx
15 22 (0.74%) Databricks
15 22 (0.74%) Planview
16 21 (0.71%) Aderant
17 18 (0.61%) HP
18 17 (0.57%) Sage