ITIL Jobs in Reading

ITIL (Information Technology Infrastructure Library)
Berkshire > Reading

The following table provides summary statistics for permanent job vacancies advertised in Reading with a requirement for ITIL skills. Included is a benchmarking guide to the salaries offered in vacancies that have cited ITIL over the 6 months to 24 April 2024 with a comparison to the same period in the previous 2 years.

6 months to
24 Apr 2024
Same period 2023 Same period 2022
Rank 14 27 48
Rank change year-on-year +13 +21 +16
Permanent jobs citing ITIL 181 146 93
As % of all permanent jobs advertised in Reading 10.58% 9.06% 5.35%
As % of the Processes & Methodologies category 11.98% 9.36% 5.78%
Number of salaries quoted 141 110 71
10th Percentile £34,500 £23,500 £26,250
25th Percentile £48,825 £28,250 £30,000
Median annual salary (50th Percentile) £54,000 £37,500 £47,500
Median % change year-on-year +44.00% -21.05% -
75th Percentile £59,000 £45,900 £68,750
90th Percentile £63,750 £71,500 £75,000
Berkshire median annual salary £55,000 £37,500 £45,000
% change year-on-year +46.67% -16.67% -5.26%

All Process and Methodology Skills
Reading

ITIL is in the Processes and Methodologies category. The following table is for comparison with the above and provides summary statistics for all permanent job vacancies advertised in Reading with a requirement for process or methodology skills.

Permanent vacancies with a requirement for process or methodology skills 1,511 1,560 1,608
As % of all permanent jobs advertised in Reading 88.31% 96.77% 92.57%
Number of salaries quoted 920 823 925
10th Percentile £30,000 £31,250 £31,250
25th Percentile £39,500 £41,250 £43,750
Median annual salary (50th Percentile) £55,000 £60,000 £60,000
Median % change year-on-year -8.33% - -
75th Percentile £70,000 £77,500 £75,000
90th Percentile £81,250 £92,500 £82,500
Berkshire median annual salary £54,995 £57,500 £57,500
% change year-on-year -4.36% - +4.55%

ITIL
Job Vacancy Trend in Reading

Job postings citing ITIL as a proportion of all IT jobs advertised in Reading.
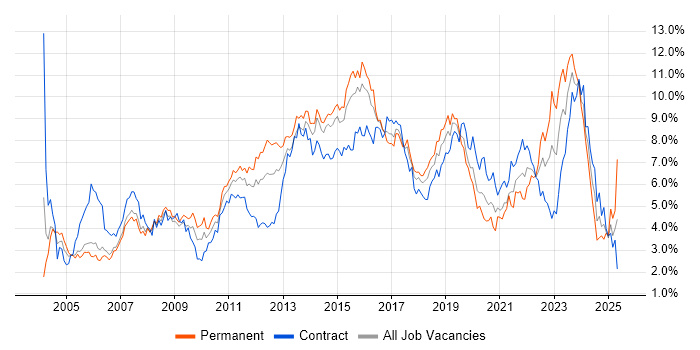
Job vacancy trend for ITIL in Reading

ITIL
Salary Trend in Reading

3-month moving average salary quoted in jobs citing ITIL in Reading.

Salary trend for ITIL in Reading

ITIL
Salary Histogram in Reading

Salary distribution for jobs citing ITIL in Reading over the 6 months to 24 April 2024.

Salary histogram for ITIL in Reading

ITIL
Co-occurring Skills and Capabilities in Reading by Category

The follow tables expand on the table above by listing co-occurrences grouped by category. The same employment type, locality and period is covered with up to 20 co-occurrences shown in each of the following categories:

Application Platforms
1 22 (12.15%) WebLogic
2 14 (7.73%) Microsoft Exchange
3 13 (7.18%) CMS
4 1 (0.55%) Oracle Spatial
Applications
1 22 (12.15%) Microsoft Office
2 1 (0.55%) Microsoft Excel
Business Applications
1 5 (2.76%) Remedy ITSM
Cloud Services
1 28 (15.47%) Azure
2 15 (8.29%) Microsoft 365
3 14 (7.73%) Azure Monitor
3 14 (7.73%) Azure Storage
3 14 (7.73%) Entra ID
4 12 (6.63%) OCI
5 7 (3.87%) IaaS
6 3 (1.66%) SaaS
7 1 (0.55%) AWS
7 1 (0.55%) Cloud Computing
Communications & Networking
1 31 (17.13%) Firewall
2 26 (14.36%) DHCP
2 26 (14.36%) DNS
3 13 (7.18%) LAN
4 12 (6.63%) SAN
5 6 (3.31%) Network Security
6 2 (1.10%) Internet
7 1 (0.55%) HTTP
7 1 (0.55%) Intrusion Detection
7 1 (0.55%) Remote Desktop
7 1 (0.55%) RNC
7 1 (0.55%) SGSN
7 1 (0.55%) SNMP
7 1 (0.55%) TCP/IP
7 1 (0.55%) WAN
7 1 (0.55%) Wi-Fi
7 1 (0.55%) Wireless
Database & Business Intelligence
1 22 (12.15%) Elasticsearch
2 1 (0.55%) GIS
2 1 (0.55%) Spatial Data
2 1 (0.55%) SQL Server
Development Applications
1 4 (2.21%) AdminStudio
1 4 (2.21%) InstallShield
1 4 (2.21%) MSI
General
1 104 (57.46%) Social Skills
2 32 (17.68%) Analytical Skills
3 22 (12.15%) Police
4 17 (9.39%) Organisational Skills
5 13 (7.18%) Public Sector
6 9 (4.97%) Finance
7 7 (3.87%) Presentation Skills
8 4 (2.21%) Retail
9 3 (1.66%) Documentation Skills
9 3 (1.66%) Inclusion and Diversity
9 3 (1.66%) Telecoms
Job Titles
1 41 (22.65%) Senior
2 31 (17.13%) Analyst
3 26 (14.36%) Infrastructure Engineer
3 26 (14.36%) Support Analyst
4 25 (13.81%) Support Specialist
5 23 (12.71%) Applications Support
5 23 (12.71%) Applications Support Analyst
5 23 (12.71%) Senior Analyst
6 22 (12.15%) Senior Applications Support
6 22 (12.15%) Senior Applications Support Analyst
6 22 (12.15%) Senior Support Analyst
7 18 (9.94%) Administrator
8 14 (7.73%) Active Directory Specialist
8 14 (7.73%) Active Directory Support
8 14 (7.73%) Azure Specialist
9 13 (7.18%) ServiceNow Administrator
9 13 (7.18%) Support Engineer
10 12 (6.63%) Desktop Support
10 12 (6.63%) Desktop Support Engineer
10 12 (6.63%) Infrastructure Support
Libraries, Frameworks & Software Standards
1 22 (12.15%) J2EE
1 22 (12.15%) Java EE
1 22 (12.15%) Spring
2 14 (7.73%) ARM Templates
3 9 (4.97%) EDI
4 3 (1.66%) AngularJS
4 3 (1.66%) CSS
4 3 (1.66%) HTML
4 3 (1.66%) JSON
4 3 (1.66%) LDAP
4 3 (1.66%) Twitter Bootstrap
4 3 (1.66%) Web Services
4 3 (1.66%) XML
5 1 (0.55%) OpenLayers
5 1 (0.55%) Regular Expression
Miscellaneous
1 18 (9.94%) Self-Motivation
2 17 (9.39%) Data Centre
3 14 (7.73%) PKI
4 13 (7.18%) Digital Signage
5 11 (6.08%) Driving Licence
6 10 (5.52%) Management Information System
7 4 (2.21%) Shadow IT
8 3 (1.66%) CMDB
8 3 (1.66%) Security Posture
9 2 (1.10%) Cyber Kill Chain
10 1 (0.55%) CCTV
10 1 (0.55%) IoT
10 1 (0.55%) iPad
10 1 (0.55%) iPhone
10 1 (0.55%) Mobile App
10 1 (0.55%) Operational Technology
Operating Systems
1 79 (43.65%) Windows
2 58 (32.04%) Windows 10
3 56 (30.94%) Windows Server 2016
3 56 (30.94%) Windows Server 2019
4 42 (23.20%) Windows Server 2012
5 40 (22.10%) Windows Server
6 32 (17.68%) Windows 7
7 26 (14.36%) Linux
8 24 (13.26%) Unix
9 14 (7.73%) Windows NT
10 12 (6.63%) Windows XP
11 1 (0.55%) Mac OS
Processes & Methodologies
1 84 (46.41%) Service Management
2 80 (44.20%) Problem-Solving
3 49 (27.07%) Customer Service
4 40 (22.10%) ITSM
5 37 (20.44%) Infrastructure Engineering
6 34 (18.78%) Service Delivery
7 31 (17.13%) Cybersecurity
8 26 (14.36%) Actionable Insight
9 24 (13.26%) Incident Management
10 23 (12.71%) Agile
10 23 (12.71%) Data-Driven Decision Making
10 23 (12.71%) Decision-Making
11 22 (12.15%) Containerisation
11 22 (12.15%) Enterprise Architecture
11 22 (12.15%) Enterprise Search
11 22 (12.15%) Impact Assessments
11 22 (12.15%) Information Management
12 21 (11.60%) Service Catalogue
12 21 (11.60%) Stakeholder Management
13 20 (11.05%) Project Management
Programming Languages
1 47 (25.97%) PowerShell
2 24 (13.26%) Shell Script
3 23 (12.71%) Java
4 18 (9.94%) C#
4 18 (9.94%) VB
5 16 (8.84%) JavaScript
6 14 (7.73%) Bicep
6 14 (7.73%) VBScript
7 2 (1.10%) SQL
8 1 (0.55%) Groovy
8 1 (0.55%) Python
8 1 (0.55%) T-SQL
Qualifications
1 132 (72.93%) Security Cleared
2 79 (43.65%) DV Cleared
2 79 (43.65%) SC Cleared
3 64 (35.36%) Degree
4 23 (12.71%) HNC
5 14 (7.73%) CCNA
5 14 (7.73%) Cisco Certification
5 14 (7.73%) ITIL Foundation Certificate
6 13 (7.18%) CCNP
7 7 (3.87%) ITIL Certification
7 7 (3.87%) Network+ Certification
8 6 (3.31%) A+ Certification
9 5 (2.76%) CISSP
9 5 (2.76%) Computer Science Degree
10 4 (2.21%) CISA
10 4 (2.21%) CISM
10 4 (2.21%) Master's Degree
11 2 (1.10%) ISACA
12 1 (0.55%) CompTIA Security+
12 1 (0.55%) SANS
Quality Assurance & Compliance
1 38 (20.99%) SLA
2 9 (4.97%) NIST
3 6 (3.31%) ISO/IEC 27001
4 5 (2.76%) COBIT
5 4 (2.21%) GDPR
5 4 (2.21%) JSP 440
5 4 (2.21%) RMADS
6 2 (1.10%) PCI DSS
7 1 (0.55%) Cyber Essentials
System Software
1 66 (36.46%) Active Directory
2 32 (17.68%) VMware Infrastructure
3 26 (14.36%) Firmware
4 14 (7.73%) Virtual Desktop
4 14 (7.73%) Virtual Machines
5 12 (6.63%) Hyper-V
5 12 (6.63%) VMware ESXi
6 4 (2.21%) Microsoft App-V
Systems Management
1 72 (39.78%) SCCM
2 47 (25.97%) WSUS
3 39 (21.55%) SCOM
4 25 (13.81%) Single Sign-On
5 22 (12.15%) OpenSSO
6 15 (8.29%) Microsoft Intune
7 14 (7.73%) Active Directory Federation Services
7 14 (7.73%) Kubernetes
7 14 (7.73%) Sysprep
8 12 (6.63%) EMC NetWorker
8 12 (6.63%) NetBackup
8 12 (6.63%) vCenter Server
Vendors
1 80 (44.20%) Microsoft
2 45 (24.86%) HP
3 37 (20.44%) Oracle
4 32 (17.68%) VMware
5 29 (16.02%) ServiceNow
6 27 (14.92%) Remedy
7 14 (7.73%) Cisco
8 13 (7.18%) Dynatrace
8 13 (7.18%) Riverbed
9 12 (6.63%) 3PAR
9 12 (6.63%) Dell
9 12 (6.63%) EMC
9 12 (6.63%) Extreme Networks
9 12 (6.63%) Juniper
9 12 (6.63%) Palo Alto
9 12 (6.63%) Symantec
9 12 (6.63%) Veeam
10 9 (4.97%) SAP
11 5 (2.76%) BMC
12 4 (2.21%) Autodesk