Analytics Job Trends in Surrey

Analytics
South East > Surrey

The table below provides summary statistics and salary benchmarking for jobs advertised in Surrey requiring Analytics skills. It covers permanent job vacancies from the 6 months leading up to 1 November 2025, with comparisons to the same periods in the previous two years.

6 months to
1 Nov 2025
Same period 2024 Same period 2023
Rank 51 28 38
Rank change year-on-year -23 +10 -2
Permanent jobs citing Analytics 44 108 50
As % of all permanent jobs in Surrey 3.81% 7.16% 5.45%
As % of the Processes & Methodologies category 4.34% 8.31% 5.97%
Number of salaries quoted 22 53 48
10th Percentile £55,125 £30,250 £30,000
25th Percentile £56,750 £45,680 £40,000
Median annual salary (50th Percentile) £65,000 £57,500 £45,750
Median % change year-on-year +13.04% +25.68% -34.64%
75th Percentile £70,938 £85,000 £63,750
90th Percentile £126,750 £95,750 £90,000
South East median annual salary £50,000 £57,000 £56,525
% change year-on-year -12.28% +0.84% -5.79%

All Process and Methodology Skills
Surrey

Analytics falls under the Processes and Methodologies category. For comparison with the information above, the following table provides summary statistics for all permanent job vacancies requiring process or methodology skills in Surrey.

Permanent vacancies with a requirement for process or methodology skills 1,014 1,300 838
As % of all permanent jobs advertised in Surrey 87.79% 86.15% 91.38%
Number of salaries quoted 720 629 598
10th Percentile £27,040 £31,250 £30,500
25th Percentile £31,500 £40,000 £41,250
Median annual salary (50th Percentile) £45,000 £55,000 £55,000
Median % change year-on-year -18.18% - -
75th Percentile £63,750 £75,000 £67,500
90th Percentile £86,250 £85,000 £77,500
South East median annual salary £47,500 £55,000 £55,000
% change year-on-year -13.64% - -

Analytics
Job Vacancy Trend in Surrey

Historical trend showing the proportion of permanent IT job postings citing Analytics relative to all permanent IT jobs advertised in Surrey.
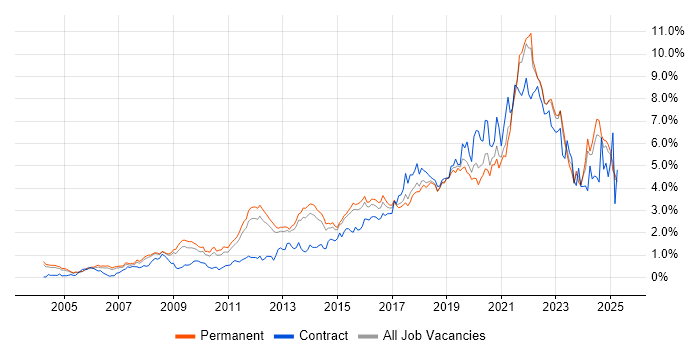
Analytics job vacancy trend in Surrey

Analytics
Salary Trend in Surrey

Salary distribution trend for jobs in Surrey citing Analytics.

Salary distribution trend for jobs in Surrey citing Analytics

Analytics
Salary Histogram in Surrey

Salary distribution for jobs citing Analytics in Surrey over the 6 months to 1 November 2025.

Salary histogram for Analytics in Surrey

Analytics
Job Locations in Surrey

The table below looks at the demand and provides a guide to the median salaries quoted in IT jobs citing Analytics within the Surrey region over the 6 months to 1 November 2025. The 'Rank Change' column provides an indication of the change in demand within each location based on the same 6 month period last year.

Location Rank Change
on Same Period
Last Year
Matching
Permanent
IT Job Ads
Median Salary
Past 6 Months
Median Salary
% Change
on Same Period
Last Year
Live
Jobs
Guildford +5 7 £58,500 -26.88% 20
Camberley +1 7 £65,000 -
Reigate +2 4 - - 4
Epsom +13 1 - - 2
Woking +7 1 £60,000 +9.09% 7
Redhill +3 1 £55,000 -31.25% 1
Staines -5 1 £95,000 +26.67% 7
Warlingham - 1 £60,000 -
Weybridge - 1 £120,000 - 1
Windlesham - 1 £60,000 -
Banstead - 1 £72,500 -
Caterham - 1 £60,000 - 1
Analytics
South East

Analytics
Co-Occurring Skills & Capabilities in Surrey by Category

The following tables expand on the one above by listing co-occurrences grouped by category. They cover the same employment type, locality and period, with up to 20 co-occurrences shown in each category:

Application Platforms
1 3 (6.82%) SharePoint
2 1 (2.27%) CMS
Applications
1 9 (20.45%) Microsoft Excel
2 5 (11.36%) Microsoft Office
3 4 (9.09%) Microsoft Project
4 1 (2.27%) Microsoft PowerPoint
Business Applications
1 4 (9.09%) Salesforce CRM
1 4 (9.09%) Shopify
2 3 (6.82%) Unit4 Business World
3 1 (2.27%) Sparx Enterprise Architect
Cloud Services
1 11 (25.00%) Azure
2 10 (22.73%) Power Platform
2 10 (22.73%) SaaS
3 4 (9.09%) Azure Data Factory
4 3 (6.82%) AWS
5 2 (4.55%) Azure Monitor
5 2 (4.55%) PaaS
6 1 (2.27%) Azure App Service
6 1 (2.27%) Azure DevOps
6 1 (2.27%) Azure ExpressRoute
6 1 (2.27%) Azure Functions
6 1 (2.27%) Azure Synapse Analytics
6 1 (2.27%) Entra ID
6 1 (2.27%) Google Analytics
6 1 (2.27%) IaaS
6 1 (2.27%) Microsoft 365
6 1 (2.27%) Serverless
Communications & Networking
1 3 (6.82%) Network Security
1 3 (6.82%) SMS
2 1 (2.27%) LoRaWAN
2 1 (2.27%) VPN
Database & Business Intelligence
1 10 (22.73%) Power BI
2 5 (11.36%) Tableau
3 3 (6.82%) Data Warehouse
3 3 (6.82%) SQL Server Integration Services
3 3 (6.82%) SQL Server Reporting Services
4 1 (2.27%) BusinessObjects Business Intelligence
4 1 (2.27%) Data Lake
4 1 (2.27%) NoSQL
4 1 (2.27%) Power Query
4 1 (2.27%) Relational Database
4 1 (2.27%) SQL Server
General
1 22 (50.00%) Social Skills
2 14 (31.82%) Marketing
3 9 (20.45%) Analytical Skills
4 7 (15.91%) Inclusion and Diversity
5 6 (13.64%) Retail
6 4 (9.09%) Local Government
6 4 (9.09%) Organisational Skills
7 3 (6.82%) Finance
8 2 (4.55%) Law
8 2 (4.55%) Legal
8 2 (4.55%) Public Sector
9 1 (2.27%) Advertising
9 1 (2.27%) Automotive
9 1 (2.27%) Influencing Skills
9 1 (2.27%) Police
9 1 (2.27%) Presentation Skills
Job Titles
1 6 (13.64%) Analyst
1 6 (13.64%) Senior
2 4 (9.09%) Consultant
2 4 (9.09%) E-Commerce Manager
2 4 (9.09%) Project Engineer
2 4 (9.09%) Project Support Engineer
2 4 (9.09%) Support Engineer
2 4 (9.09%) Technical Engineer
2 4 (9.09%) Technical Support
2 4 (9.09%) Technical Support Engineer
3 3 (6.82%) Business Analyst
3 3 (6.82%) Business Consultant
3 3 (6.82%) Business Development Consultant
3 3 (6.82%) CRM Executive
3 3 (6.82%) Developer
3 3 (6.82%) Development Consultant
3 3 (6.82%) Insight Manager
3 3 (6.82%) SOC Manager
4 2 (4.55%) Business Intelligence Analyst
4 2 (4.55%) Business Manager
Libraries, Frameworks & Software Standards
1 1 (2.27%) Middleware
Miscellaneous
1 9 (20.45%) Onboarding
2 4 (9.09%) Robotics
2 4 (9.09%) Self-Motivation
3 3 (6.82%) Cyber Threat
3 3 (6.82%) Security Operations Centre
4 2 (4.55%) Data Protection Act
5 1 (2.27%) Analytical Mindset
5 1 (2.27%) Augmented Reality
5 1 (2.27%) Data Fabric
5 1 (2.27%) IoT
Operating Systems
1 1 (2.27%) VMS
Processes & Methodologies
1 15 (34.09%) Decision-Making
2 13 (29.55%) Data Analytics
3 11 (25.00%) Business Intelligence
3 11 (25.00%) Data-Driven Decision Making
4 8 (18.18%) CRM
4 8 (18.18%) Cybersecurity
5 7 (15.91%) Roadmaps
5 7 (15.91%) Stakeholder Management
5 7 (15.91%) User Experience
5 7 (15.91%) Visualisation
6 6 (13.64%) Actionable Insight
6 6 (13.64%) AI
6 6 (13.64%) Data Modelling
6 6 (13.64%) E-Commerce
7 5 (11.36%) Conversion Rate Optimisation
7 5 (11.36%) Customer Engagement
7 5 (11.36%) Customer-Centricity
7 5 (11.36%) ETL
7 5 (11.36%) Project Management
7 5 (11.36%) SEO
Programming Languages
1 18 (40.91%) SQL
2 7 (15.91%) Python
3 5 (11.36%) PowerShell
4 4 (9.09%) Data Analysis Expressions
4 4 (9.09%) Kusto Query Language
5 3 (6.82%) Bash
6 2 (4.55%) R
7 1 (2.27%) ABAP
7 1 (2.27%) Java
Qualifications
1 9 (20.45%) Degree
2 3 (6.82%) CompTIA Security+
2 3 (6.82%) CREST Certified
2 3 (6.82%) DBS Check
2 3 (6.82%) Microsoft Certification
2 3 (6.82%) Network+ Certification
3 2 (4.55%) Master's Degree
4 1 (2.27%) Azure Certification
4 1 (2.27%) CIPD
4 1 (2.27%) Security Cleared
Quality Assurance & Compliance
1 7 (15.91%) GDPR
2 3 (6.82%) ISO/IEC 27001
2 3 (6.82%) NIST
2 3 (6.82%) QA
2 3 (6.82%) SLA
3 1 (2.27%) Sarbanes-Oxley
Systems Management
1 1 (2.27%) Microsoft Intune
1 1 (2.27%) Terraform
Vendors
1 11 (25.00%) Microsoft
2 9 (20.45%) Salesforce
3 5 (11.36%) SAP
4 4 (9.09%) Salesforce Marketing Cloud
5 1 (2.27%) BiZZdesign
5 1 (2.27%) Databricks
5 1 (2.27%) Google
5 1 (2.27%) Medallia
5 1 (2.27%) Qualtrics
5 1 (2.27%) Samsung
5 1 (2.27%) Sparx
5 1 (2.27%) Xero