Analytics Jobs in the South East

Analytics
England > South East

The following table provides summary statistics for permanent job vacancies advertised in the South East with a requirement for Analytics skills. Included is a benchmarking guide to the salaries offered in vacancies that have cited Analytics over the 6 months to 6 December 2023 with a comparison to the same period in the previous 2 years.

6 months to
6 Dec 2023
Same period 2022 Same period 2021
Rank 41 36 30
Rank change year-on-year -5 -6 +49
Permanent jobs citing Analytics 425 1,201 1,485
As % of all permanent jobs advertised in the South East 5.50% 6.99% 8.16%
As % of the Processes & Methodologies category 5.91% 7.34% 8.60%
Number of salaries quoted 285 534 712
10th Percentile £32,750 £38,100 £36,757
25th Percentile £42,500 £47,500 £42,500
Median annual salary (50th Percentile) £57,500 £60,000 £57,500
Median % change year-on-year -4.17% +4.35% +4.55%
75th Percentile £73,750 £75,000 £72,500
90th Percentile £82,500 £86,250 £85,000
England median annual salary £65,000 £67,293 £65,000
% change year-on-year -3.41% +3.53% +4.00%

All Process and Methodology Skills
South East

Analytics is in the Processes and Methodologies category. The following table is for comparison with the above and provides summary statistics for all permanent job vacancies advertised in the South East with a requirement for process or methodology skills.

Permanent vacancies with a requirement for process or methodology skills 7,196 16,354 17,274
As % of all permanent jobs advertised in the South East 93.10% 95.12% 94.95%
Number of salaries quoted 4,827 9,899 11,715
10th Percentile £30,500 £31,250 £31,250
25th Percentile £40,000 £41,750 £40,750
Median annual salary (50th Percentile) £54,500 £55,000 £52,500
Median % change year-on-year -0.91% +4.76% +5.00%
75th Percentile £67,500 £72,500 £67,500
90th Percentile £82,500 £85,000 £80,000
England median annual salary £60,000 £62,500 £60,000
% change year-on-year -4.00% +4.17% +9.09%

Analytics
Job Vacancy Trend in the South East

Job postings citing Analytics as a proportion of all IT jobs advertised in the South East.
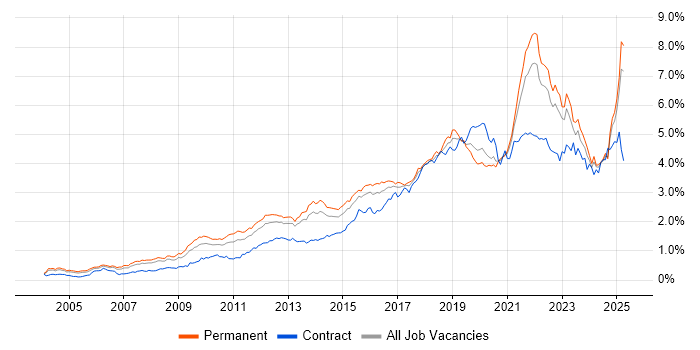
Job vacancy trend for Analytics in the South East

Analytics
Salary Trend in the South East

3-month moving average salary quoted in jobs citing Analytics in the South East.

Salary trend for Analytics in the South East

Analytics
Salary Histogram in the South East

Salary distribution for jobs citing Analytics in the South East over the 6 months to 6 December 2023.

Salary histogram for Analytics in the South East

Analytics
Job Locations in the South East

The table below looks at the demand and provides a guide to the median salaries quoted in IT jobs citing Analytics within the South East region over the 6 months to 6 December 2023. The 'Rank Change' column provides an indication of the change in demand within each location based on the same 6 month period last year.

Location Rank Change
on Same Period
Last Year
Matching
Permanent
IT Job Ads
Median Salary
Past 6 Months
Median Salary
% Change
on Same Period
Last Year
Live
Jobs
Thames Valley -12 193 £60,000 -7.69% 91
Hampshire +27 119 £68,500 +24.55% 21
Berkshire -36 87 £56,525 -13.04% 46
Buckinghamshire +15 73 £63,500 +5.83% 27
Surrey -18 37 £42,500 -38.41% 46
Oxfordshire +10 33 £51,250 -18.00% 18
West Sussex -11 33 £43,250 -27.92% 23
Kent +26 23 £60,000 +4.35% 14
East Sussex +10 20 £62,500 +20.19% 14
Analytics
England

Analytics
Co-occurring Skills and Capabilities in the South East by Category

The follow tables expand on the table above by listing co-occurrences grouped by category. The same employment type, locality and period is covered with up to 20 co-occurrences shown in each of the following categories:

Application Platforms
1 15 (3.53%) SharePoint
2 12 (2.82%) Apache Spark
3 4 (0.94%) Apache
3 4 (0.94%) Apache Airflow
4 3 (0.71%) WordPress
5 2 (0.47%) CMS
6 1 (0.24%) Confluence
6 1 (0.24%) IIS
6 1 (0.24%) Jupyter
6 1 (0.24%) Luigi
6 1 (0.24%) OpenStack
6 1 (0.24%) Tomcat
6 1 (0.24%) WebLogic
Applications
1 18 (4.24%) Microsoft Excel
2 13 (3.06%) Microsoft Office
3 7 (1.65%) Spreadsheet
4 5 (1.18%) Microsoft PowerPoint
5 2 (0.47%) Sketch
6 1 (0.24%) Adobe Creative Suite
6 1 (0.24%) InDesign
6 1 (0.24%) Photoshop
Business Applications
1 10 (2.35%) SAP S/4HANA
2 6 (1.41%) SAP CO
2 6 (1.41%) SAP FI
2 6 (1.41%) SAP FI/CO
3 3 (0.71%) IBM Planning Analytics
3 3 (0.71%) Magento
4 2 (0.47%) Hyperion Planning
4 2 (0.47%) SAP PP
4 2 (0.47%) SAP SD
5 1 (0.24%) Eloqua
5 1 (0.24%) iTrent
5 1 (0.24%) Oracle Applications
5 1 (0.24%) Oracle EBS
5 1 (0.24%) Workday HCM
Cloud Services
1 148 (34.82%) Azure
2 86 (20.24%) Power Platform
3 48 (11.29%) AWS
4 28 (6.59%) Entra ID
5 26 (6.12%) Azure DevOps
5 26 (6.12%) Serverless
6 24 (5.65%) SaaS
7 23 (5.41%) Azure Monitor
7 23 (5.41%) Azure Storage
7 23 (5.41%) GCP
8 21 (4.94%) Microsoft 365
9 20 (4.71%) Azure Data Factory
10 19 (4.47%) Azure Synapse Analytics
11 14 (3.29%) Google Analytics
11 14 (3.29%) Snowflake
12 10 (2.35%) PowerApps
13 8 (1.88%) PaaS
14 7 (1.65%) Cloud Computing
14 7 (1.65%) Matillion
15 6 (1.41%) GitHub
Communications & Networking
1 38 (8.94%) Firewall
2 22 (5.18%) DHCP
2 22 (5.18%) DNS
3 12 (2.82%) Wireless
4 7 (1.65%) Network Security
5 4 (0.94%) VoIP
6 3 (0.71%) Software-Defined Networking
7 2 (0.47%) SMS
8 1 (0.24%) IPv4
8 1 (0.24%) IPv6
8 1 (0.24%) Kerberos
8 1 (0.24%) TCP/IP
8 1 (0.24%) VPN
Database & Business Intelligence
1 86 (20.24%) Power BI
2 54 (12.71%) Data Warehouse
3 53 (12.47%) Looker
4 34 (8.00%) Data Lake
5 23 (5.41%) SQL Server
6 20 (4.71%) Big Data
6 20 (4.71%) SQL Server Analysis Services
7 18 (4.24%) Metadata
8 15 (3.53%) Relational Database
9 14 (3.29%) Tableau
10 13 (3.06%) SQL Server Integration Services
11 10 (2.35%) Data Vault
11 10 (2.35%) Microsoft Analysis Services
12 8 (1.88%) NoSQL
12 8 (1.88%) SQL Server Reporting Services
12 8 (1.88%) Star Schema
13 6 (1.41%) Amazon Redshift
13 6 (1.41%) MongoDB
13 6 (1.41%) MySQL
13 6 (1.41%) OLAP
Development Applications
1 13 (3.06%) Axure RP
2 12 (2.82%) JIRA
3 10 (2.35%) GitLab
4 9 (2.12%) Jenkins
5 6 (1.41%) Git
5 6 (1.41%) Visual Studio Team System
6 5 (1.18%) Gradle
6 5 (1.18%) Maven
7 4 (0.94%) Jasmine
8 3 (0.71%) Eclipse
8 3 (0.71%) IntelliJ
8 3 (0.71%) Mockito
9 2 (0.47%) SQL Server Management Studio (SSMS)
9 2 (0.47%) Visual Studio
10 1 (0.24%) ERwin
10 1 (0.24%) NUnit
10 1 (0.24%) SonarQube
10 1 (0.24%) Subversion
10 1 (0.24%) TeamCity
10 1 (0.24%) Visual Website Optimizer
General
1 179 (42.12%) Social Skills
2 106 (24.94%) Analytical Skills
3 90 (21.18%) Finance
4 49 (11.53%) Manufacturing
5 34 (8.00%) Marketing
6 15 (3.53%) Aviation
7 12 (2.82%) Financial Institution
8 11 (2.59%) Law
9 10 (2.35%) Inclusion and Diversity
10 9 (2.12%) Influencing Skills
10 9 (2.12%) Legal
10 9 (2.12%) Retail
11 8 (1.88%) Telecoms
12 6 (1.41%) Presentation Skills
12 6 (1.41%) Public Sector
13 5 (1.18%) Banking
13 5 (1.18%) Organisational Skills
14 4 (0.94%) Advertising
14 4 (0.94%) Pharmaceutical
15 3 (0.71%) Automotive
Job Titles
1 126 (29.65%) Analyst
2 57 (13.41%) Senior
3 53 (12.47%) Architect
4 36 (8.47%) Data Engineer
5 31 (7.29%) Developer
6 25 (5.88%) Data Architect
6 25 (5.88%) Solutions Architect
7 21 (4.94%) Data Analyst
8 20 (4.71%) Presales Solution Architect
9 19 (4.47%) HR Analyst
10 14 (3.29%) Analytics Manager
10 14 (3.29%) Lead
11 13 (3.06%) Active Directory Specialist
11 13 (3.06%) Data Analytics Manager
11 13 (3.06%) Data Scientist
11 13 (3.06%) Product Manager
11 13 (3.06%) Senior Data Engineer
11 13 (3.06%) Senior Developer
12 12 (2.82%) Consultant
12 12 (2.82%) Data Manager
Libraries, Frameworks & Software Standards
1 18 (4.24%) HTML
2 14 (3.29%) 802.1X
3 13 (3.06%) Node.js
4 11 (2.59%) ARM Templates
4 11 (2.59%) CSS
5 8 (1.88%) XML
6 7 (1.65%) PySpark
6 7 (1.65%) React
7 5 (1.18%) AngularJS
7 5 (1.18%) EDI
7 5 (1.18%) HTML5
7 5 (1.18%) Web Services
8 4 (0.94%) JSON
8 4 (0.94%) Kafka
9 3 (0.71%) .NET
9 3 (0.71%) jQuery
9 3 (0.71%) RabbitMQ
9 3 (0.71%) Velocity
10 2 (0.47%) OAuth
10 2 (0.47%) OpenID
Miscellaneous
1 22 (5.18%) PKI
2 20 (4.71%) Self-Motivation
3 14 (3.29%) Product Ownership
4 11 (2.59%) Management Information System
5 10 (2.35%) Data Structures
6 8 (1.88%) Legacy Systems
7 7 (1.65%) Analytical Mindset
7 7 (1.65%) IoT
8 6 (1.41%) Algorithms
8 6 (1.41%) Cyber Threat
8 6 (1.41%) Enterprise Software
8 6 (1.41%) Marketing Technology
8 6 (1.41%) Mobile App
8 6 (1.41%) Onboarding
8 6 (1.41%) Public Cloud
9 5 (1.18%) NHS
10 4 (0.94%) Biopharmaceutical
10 4 (0.94%) FMCG
10 4 (0.94%) Life Science
11 3 (0.71%) Operational Technology
Operating Systems
1 45 (10.59%) Windows
2 12 (2.82%) Windows Server
2 12 (2.82%) Windows Server 2016
2 12 (2.82%) Windows Server 2019
3 10 (2.35%) Linux
4 5 (1.18%) Ubuntu
5 1 (0.24%) Unix
5 1 (0.24%) Windows 10
Processes & Methodologies
1 166 (39.06%) Business Intelligence
2 108 (25.41%) Agile
3 81 (19.06%) Problem-Solving
4 71 (16.71%) Data Analytics
5 66 (15.53%) Stakeholder Management
6 65 (15.29%) Data Modelling
7 58 (13.65%) DevOps
8 53 (12.47%) Visualisation
9 50 (11.76%) ETL
10 49 (11.53%) Machine Learning
10 49 (11.53%) Stakeholder and Relationship Management
11 48 (11.29%) Case Management
11 48 (11.29%) Data Science
12 44 (10.35%) Data Analysis
13 41 (9.65%) Decision-Making
14 39 (9.18%) Roadmaps
15 38 (8.94%) Data Management
16 37 (8.71%) Mentoring
17 35 (8.24%) Data Strategy
18 34 (8.00%) Data Visualisation
Programming Languages
1 108 (25.41%) SQL
2 70 (16.47%) Python
3 35 (8.24%) C#
4 30 (7.06%) PowerShell
5 24 (5.65%) Java
6 22 (5.18%) VB
6 22 (5.18%) VBScript
7 21 (4.94%) Data Analysis Expressions
7 21 (4.94%) T-SQL
8 15 (3.53%) JavaScript
8 15 (3.53%) R
9 12 (2.82%) Bicep
9 12 (2.82%) Go
10 9 (2.12%) C++
11 5 (1.18%) ABAP
11 5 (1.18%) Ruby
11 5 (1.18%) Scala
12 4 (0.94%) PHP
13 3 (0.71%) TypeScript
14 2 (0.47%) Bash
Qualifications
1 109 (25.65%) Degree
2 69 (16.24%) Security Cleared
3 57 (13.41%) SC Cleared
4 27 (6.35%) DV Cleared
5 22 (5.18%) ITIL Foundation Certificate
6 20 (4.71%) Azure Certification
7 8 (1.88%) AWS Certification
7 8 (1.88%) Computer Science Degree
7 8 (1.88%) Master's Degree
8 4 (0.94%) (ISC)2 CCSP
8 4 (0.94%) CCSP
8 4 (0.94%) Cisco Certification
9 3 (0.71%) CompTIA Security+
9 3 (0.71%) IBM Certification
9 3 (0.71%) Network+ Certification
9 3 (0.71%) Numerate Degree
9 3 (0.71%) PhD
9 3 (0.71%) PMI Certification
9 3 (0.71%) PMP
9 3 (0.71%) Tableau Certification
Quality Assurance & Compliance
1 43 (10.12%) Data Quality
2 24 (5.65%) GDPR
3 13 (3.06%) QA
4 3 (0.71%) GRC
4 3 (0.71%) PMO
5 2 (0.47%) NIST
5 2 (0.47%) WCAG
6 1 (0.24%) Accessibility
6 1 (0.24%) Cyber Essentials
6 1 (0.24%) ISO/IEC 27001
6 1 (0.24%) MiFID
6 1 (0.24%) NCSC
System Software
1 29 (6.82%) Active Directory
2 22 (5.18%) Virtual Desktop
2 22 (5.18%) Virtual Machines
3 9 (2.12%) Docker
Systems Management
1 39 (9.18%) Kubernetes
2 26 (6.12%) Microsoft Intune
3 22 (5.18%) Active Directory Federation Services
3 22 (5.18%) SCCM
3 22 (5.18%) SCOM
3 22 (5.18%) WSUS
4 12 (2.82%) Terraform
5 4 (0.94%) Grafana
6 3 (0.71%) Ansible
6 3 (0.71%) Computer Emergency Response Teams
6 3 (0.71%) Prometheus
7 1 (0.24%) Docker Swarm
7 1 (0.24%) Mesos
7 1 (0.24%) Oozie
7 1 (0.24%) Progress Chef
7 1 (0.24%) Puppet
Vendors
1 94 (22.12%) Microsoft
2 36 (8.47%) Databricks
3 19 (4.47%) Google
4 14 (3.29%) SAP
5 10 (2.35%) Oracle
5 10 (2.35%) Splunk
6 9 (2.12%) Informatica
7 8 (1.88%) IBM
8 6 (1.41%) Salesforce
8 6 (1.41%) ServiceNow
9 5 (1.18%) Cognos
10 4 (0.94%) HubSpot
11 3 (0.71%) Adobe
11 3 (0.71%) Carbon Black
11 3 (0.71%) Cognizant
11 3 (0.71%) Cybereason
11 3 (0.71%) Sun
12 2 (0.47%) ClickTale
12 2 (0.47%) Facebook
12 2 (0.47%) Hyperion