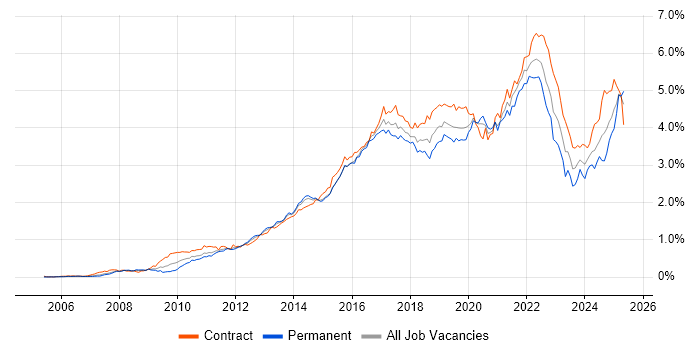
JIRA Contract Job Trends in Central London

Atlassian JIRA
London > Central London

The table below provides summary statistics and contractor rates for jobs advertised in Central London requiring JIRA skills. It covers vacancies from the 6 months leading up to 17 September 2025, with comparisons to the same periods in the previous two years.

6 months to
17 Sep 2025
Same period 2024 Same period 2023
Rank 30 47 50
Rank change year-on-year +17 +3 -19
Contract jobs citing JIRA 126 98 131
As % of all contract jobs advertised in Central London 6.47% 4.26% 4.04%
As % of the Development Applications category 44.37% 31.61% 30.90%
Number of daily rates quoted 92 63 91
10th Percentile £313 £344 £388
25th Percentile £387 £444 £459
Median daily rate (50th Percentile) £500 £525 £575
Median % change year-on-year -4.76% -8.70% -
75th Percentile £638 £626 £669
90th Percentile £675 £784 £788
London median daily rate £525 £525 £550
% change year-on-year - -4.55% -
Number of hourly rates quoted 1 0 0
10th Percentile - - -
25th Percentile £86.25 - -
Median hourly rate £87.50 - -
75th Percentile £88.75 - -
90th Percentile - - -
London median hourly rate £44.50 £32.50 £54.00
% change year-on-year +36.92% -39.81% +213.04%

All Development Application Skills
Central London

JIRA falls under the Development Applications category. For comparison with the information above, the following table provides summary statistics for all contract job vacancies requiring development application skills in Central London.

Contract vacancies with a requirement for development application skills 284 310 424
As % of all contract IT jobs advertised in Central London 14.59% 13.48% 13.07%
Number of daily rates quoted 197 205 289
10th Percentile £355 £400 £387
25th Percentile £418 £475 £463
Median daily rate (50th Percentile) £550 £565 £600
Median % change year-on-year -2.65% -5.83% -
75th Percentile £638 £688 £700
90th Percentile £700 £786 £800
London median daily rate £525 £550 £575
% change year-on-year -4.55% -4.35% -4.17%
Number of hourly rates quoted 2 0 0
10th Percentile £63.75 - -
25th Percentile £67.50 - -
Median hourly rate £75.00 - -
75th Percentile £82.50 - -
90th Percentile £86.25 - -
London median hourly rate £45.00 £46.25 £68.30
% change year-on-year -2.70% -32.28% +54.84%

JIRA
Job Vacancy Trend in Central London

Job postings citing JIRA as a proportion of all IT jobs advertised in Central London.

Job vacancy trend for JIRA in Central London

JIRA
Daily Rate Trend in Central London

Contractor daily rate distribution trend for jobs in Central London citing JIRA.

Contractor daily rate distribution trend for jobs in Central London citing JIRA

JIRA
Daily Rate Histogram in Central London

Daily rate distribution for jobs citing JIRA in Central London over the 6 months to 17 September 2025.

Daily rate histogram for JIRA in Central London

JIRA
Hourly Rate Trend in Central London

Contractor hourly rate distribution trend for jobs in Central London citing JIRA.

Contractor hourly rate distribution trend for jobs in Central London citing JIRA

JIRA
Contract Job Locations in Central London

The table below looks at the demand and provides a guide to the median contractor rates quoted in IT jobs citing JIRA within the Central London region over the 6 months to 17 September 2025. The 'Rank Change' column provides an indication of the change in demand within each location based on the same 6 month period last year.

Location Rank Change
on Same Period
Last Year
Matching
Contract
IT Job Ads
Median
Daily Rate
Past 6 Months
Median Daily Rate
% Change
on Same Period
Last Year
Live
Jobs
City of London +14 115 £500 -5.88% 102
City of Westminster - 2 £230 - 1
Southwark - 1 - -
JIRA
London

JIRA
Co-occurring Skills and Capabilities in Central London by Category

The follow tables expand on the table above by listing co-occurrences grouped by category. The same employment type, locality and period is covered with up to 20 co-occurrences shown in each of the following categories:

Application Platforms
1 57 (45.24%) Confluence
2 8 (6.35%) SharePoint
3 5 (3.97%) CMS
4 4 (3.17%) Drupal
4 4 (3.17%) WordPress
5 2 (1.59%) Adobe Experience Manager
5 2 (1.59%) Apache
5 2 (1.59%) Apache Spark
5 2 (1.59%) Jupyter
6 1 (0.79%) Camunda
6 1 (0.79%) nginx
6 1 (0.79%) Oracle SOA Suite
6 1 (0.79%) Oracle Workflow
6 1 (0.79%) WebSphere
Applications
1 12 (9.52%) Microsoft Excel
2 9 (7.14%) MS Visio
3 8 (6.35%) Microsoft Project
4 7 (5.56%) Microsoft Office
5 6 (4.76%) Microsoft PowerPoint
6 2 (1.59%) Spreadsheet
6 2 (1.59%) Trello
7 1 (0.79%) Adobe XD
7 1 (0.79%) InVision
7 1 (0.79%) Sketch
Business Applications
1 3 (2.38%) SAP S/4HANA
2 2 (1.59%) Dynamics CRM
2 2 (1.59%) Remedy ITSM
3 1 (0.79%) Aladdin
3 1 (0.79%) Oracle BPM
3 1 (0.79%) Salesforce CRM
3 1 (0.79%) Unit4 Business World
Cloud Services
1 24 (19.05%) Azure
2 19 (15.08%) AWS
3 13 (10.32%) Power Platform
4 10 (7.94%) Azure DevOps
5 5 (3.97%) Dynamics 365
5 5 (3.97%) Microsoft 365
5 5 (3.97%) Power Automate
5 5 (3.97%) PowerApps
6 4 (3.17%) GitHub
6 4 (3.17%) Miro
7 3 (2.38%) Amazon CloudWatch
7 3 (2.38%) AWS Lambda
7 3 (2.38%) Figma
7 3 (2.38%) GitHub Actions
7 3 (2.38%) IaaS
7 3 (2.38%) SaaS
7 3 (2.38%) Serverless
8 2 (1.59%) Amazon EC2
8 2 (1.59%) AWS CloudFormation
8 2 (1.59%) PaaS
Communications & Networking
1 6 (4.76%) Firewall
2 3 (2.38%) DNS
2 3 (2.38%) SSH
3 2 (1.59%) SSL
3 2 (1.59%) TCP/IP
3 2 (1.59%) WAN
4 1 (0.79%) DKIM
4 1 (0.79%) LAN
4 1 (0.79%) OpenLDAP
4 1 (0.79%) VPN
Database & Business Intelligence
1 11 (8.73%) Power BI
2 7 (5.56%) Oracle Database
3 6 (4.76%) PostgreSQL
4 5 (3.97%) Redis
4 5 (3.97%) SQL Server
5 3 (2.38%) Data Lake
6 2 (1.59%) Apache Hive
6 2 (1.59%) Azure SQL Database
6 2 (1.59%) Data Warehouse
6 2 (1.59%) Delta Lake
6 2 (1.59%) Metadata
6 2 (1.59%) Relational Database
7 1 (0.79%) Amazon RDS
7 1 (0.79%) Big Data
7 1 (0.79%) GIS
7 1 (0.79%) Hadoop
7 1 (0.79%) NoSQL
7 1 (0.79%) SQL Server Integration Services
7 1 (0.79%) SQL Server Reporting Services
7 1 (0.79%) Tableau
Development Applications
1 16 (12.70%) Git
2 10 (7.94%) Postman
3 9 (7.14%) Jenkins
4 8 (6.35%) SonarQube
5 7 (5.56%) REST Assured
6 6 (4.76%) JUnit
6 6 (4.76%) Selenium
7 5 (3.97%) Atlassian Bamboo
7 5 (3.97%) Bitbucket
7 5 (3.97%) Maven
7 5 (3.97%) Mockito
7 5 (3.97%) SoapUI
7 5 (3.97%) Subversion
7 5 (3.97%) Xcode
7 5 (3.97%) XCTest
8 4 (3.17%) GitLab
8 4 (3.17%) ScriptRunner
9 3 (2.38%) Cypress.io
9 3 (2.38%) Zephyr
10 2 (1.59%) TeamCity
General
1 54 (42.86%) Social Skills
2 53 (42.06%) Finance
3 32 (25.40%) Banking
4 21 (16.67%) Analytical Skills
5 6 (4.76%) Inclusion and Diversity
5 6 (4.76%) Investment Banking
5 6 (4.76%) Public Sector
6 5 (3.97%) Organisational Skills
6 5 (3.97%) Telecoms
7 3 (2.38%) Documentation Skills
8 2 (1.59%) Back Office
8 2 (1.59%) Financial Institution
8 2 (1.59%) Front Office
8 2 (1.59%) Law
8 2 (1.59%) Legal
8 2 (1.59%) Presentation Skills
8 2 (1.59%) Retail
8 2 (1.59%) Retail Banking
9 1 (0.79%) Billing
9 1 (0.79%) Private Banking
Job Titles
1 24 (19.05%) Analyst
2 15 (11.90%) Business Analyst
3 13 (10.32%) Developer
4 12 (9.52%) Senior
5 10 (7.94%) Project Manager
6 9 (7.14%) Product Owner
7 8 (6.35%) Consultant
8 7 (5.56%) Architect
9 6 (4.76%) Lead
9 6 (4.76%) Solutions Architect
9 6 (4.76%) Tester
10 4 (3.17%) Administrator
10 4 (3.17%) Data Engineer
10 4 (3.17%) Front-End Developer (Client-Side Developer)
11 3 (2.38%) Angular Developer
11 3 (2.38%) IT Manager
11 3 (2.38%) Management Consultant
11 3 (2.38%) Senior Architect
11 3 (2.38%) Senior Manager
11 3 (2.38%) Test Manager
Libraries, Frameworks & Software Standards
1 14 (11.11%) HTML
2 13 (10.32%) REST
3 12 (9.52%) CSS
4 10 (7.94%) AngularJS
4 10 (7.94%) HTML5
5 9 (7.14%) SOAP
6 8 (6.35%) Web Services
7 7 (5.56%) Spring
8 6 (4.76%) JPA
8 6 (4.76%) Kafka
8 6 (4.76%) Spring Boot
8 6 (4.76%) Swagger
9 5 (3.97%) Bootstrap
9 5 (3.97%) CSS3
9 5 (3.97%) Hibernate
9 5 (3.97%) J2EE
9 5 (3.97%) JSON
9 5 (3.97%) Material-UI
9 5 (3.97%) Spring Cloud
9 5 (3.97%) Spring MVC
Miscellaneous
1 18 (14.29%) Product Ownership
2 7 (5.56%) Distributed Systems
3 4 (3.17%) Fixed Income
3 4 (3.17%) Foreign Exchange (FX)
3 4 (3.17%) Management Information System
3 4 (3.17%) Mobile App
3 4 (3.17%) Reinsurance
3 4 (3.17%) SWIFT Messaging Network
4 3 (2.38%) Linux Command Line
4 3 (2.38%) Reference Data
5 2 (1.59%) Analytical Mindset
5 2 (1.59%) Data Centre
5 2 (1.59%) Data Structures
5 2 (1.59%) Derivative
5 2 (1.59%) Distributed Architecture
5 2 (1.59%) NHS
5 2 (1.59%) PMI
5 2 (1.59%) Self-Motivation
6 1 (0.79%) Credit Risk
6 1 (0.79%) Mainframe
Operating Systems
1 9 (7.14%) Unix
2 6 (4.76%) Windows
3 5 (3.97%) Linux
4 2 (1.59%) Android
4 2 (1.59%) Apple iOS
5 1 (0.79%) Mac OS
5 1 (0.79%) Windows Server
Processes & Methodologies
1 82 (65.08%) Agile
2 32 (25.40%) Problem-Solving
3 31 (24.60%) Scrum
4 29 (23.02%) Stakeholder Management
5 27 (21.43%) DevOps
6 20 (15.87%) Roadmaps
6 20 (15.87%) User Stories
7 18 (14.29%) Continuous Improvement
8 17 (13.49%) Project Management
8 17 (13.49%) Stakeholder Engagement
9 14 (11.11%) CI/CD
9 14 (11.11%) Migration
9 14 (11.11%) Test Automation
9 14 (11.11%) User Acceptance Testing
10 12 (9.52%) Mentoring
10 12 (9.52%) SDLC
11 10 (7.94%) Backlog Management
11 10 (7.94%) Microservices
12 9 (7.14%) Project Delivery
12 9 (7.14%) Workshop Facilitation
Programming Languages
1 21 (16.67%) SQL
2 20 (15.87%) Java
3 17 (13.49%) JavaScript
4 13 (10.32%) Python
5 9 (7.14%) Groovy
6 6 (4.76%) Shell Script
7 4 (3.17%) Bash
7 4 (3.17%) C#
8 3 (2.38%) Scala
8 3 (2.38%) TypeScript
9 2 (1.59%) Apex Code
9 2 (1.59%) PowerShell
10 1 (0.79%) C
10 1 (0.79%) COBOL
10 1 (0.79%) Go
10 1 (0.79%) JCL
10 1 (0.79%) Kotlin
10 1 (0.79%) SOQL
10 1 (0.79%) VBA
Qualifications
1 18 (14.29%) SC Cleared
1 18 (14.29%) Security Cleared
2 14 (11.11%) Degree
3 5 (3.97%) BPSS Clearance
4 4 (3.17%) Computer Science Degree
5 3 (2.38%) PMI Certification
6 2 (1.59%) ITIL Foundation Certificate
6 2 (1.59%) PMP
7 1 (0.79%) APMG
7 1 (0.79%) AWS Certification
7 1 (0.79%) CBAP
7 1 (0.79%) CISA
7 1 (0.79%) CISSP
7 1 (0.79%) CRISC
7 1 (0.79%) CSPO
7 1 (0.79%) CSSLP
7 1 (0.79%) ISTQB
7 1 (0.79%) PhD
7 1 (0.79%) PRINCE2 Certification
7 1 (0.79%) SANS
Quality Assurance & Compliance
1 15 (11.90%) QA
2 8 (6.35%) Accessibility
3 7 (5.56%) PMO
4 4 (3.17%) GDPR
4 4 (3.17%) ISO/IEC 27001
5 3 (2.38%) ISO 20022
5 3 (2.38%) SEPA
5 3 (2.38%) WCAG
6 2 (1.59%) Data Quality
6 2 (1.59%) NCSC
6 2 (1.59%) NIST
7 1 (0.79%) COBIT
7 1 (0.79%) HMG Security Policy Framework
7 1 (0.79%) PCI DSS
7 1 (0.79%) PSD2
7 1 (0.79%) SLA
System Software
1 9 (7.14%) Docker
2 1 (0.79%) Active Directory
2 1 (0.79%) Tivoli Workload Scheduler
Systems Management
1 8 (6.35%) Kubernetes
2 3 (2.38%) Terraform
3 2 (1.59%) HP ALM
3 2 (1.59%) Single Sign-On
4 1 (0.79%) Ambari
4 1 (0.79%) Consul
4 1 (0.79%) ITRS Geneos
4 1 (0.79%) Opsgenie
4 1 (0.79%) Packer
4 1 (0.79%) Puppet
4 1 (0.79%) SCCM
4 1 (0.79%) Tivoli
4 1 (0.79%) ZABBIX
Vendors
1 25 (19.84%) Microsoft
2 8 (6.35%) Oracle
2 8 (6.35%) ServiceNow
3 7 (5.56%) Salesforce
4 6 (4.76%) Atlassian
4 6 (4.76%) CA Agile Central
4 6 (4.76%) Splunk
5 5 (3.97%) Dynatrace
5 5 (3.97%) SAP
6 4 (3.17%) Databricks
6 4 (3.17%) HP
7 3 (2.38%) Adobe
8 2 (1.59%) BMC
8 2 (1.59%) DocuSign
8 2 (1.59%) Google
8 2 (1.59%) IBM
8 2 (1.59%) Ivanti
8 2 (1.59%) Palo Alto
8 2 (1.59%) Remedy
8 2 (1.59%) Tenable