Banking Contracts in Central London

Banking
London > Central London

The table below looks at the prevalence of the term Banking in contract job vacancies in Central London. Included is a benchmarking guide to the contractor rates offered in vacancies that cited Banking over the 6 months leading up to 1 May 2025, comparing them to the same period in the previous two years.

6 months to
1 May 2025
Same period 2024 Same period 2023
Rank 11 13 10
Rank change year-on-year +2 -3 +3
Contract jobs citing Banking 278 250 498
As % of all contract jobs advertised in Central London 13.92% 10.22% 12.92%
As % of the General category 19.77% 15.53% 20.78%
Number of daily rates quoted 157 189 392
10th Percentile £375 £350 £461
25th Percentile £475 £510 £538
Median daily rate (50th Percentile) £600 £600 £675
Median % change year-on-year - -11.11% +3.85%
75th Percentile £700 £725 £775
90th Percentile £838 £867 £888
London median daily rate £650 £650 £675
% change year-on-year - -3.70% +3.85%
Number of hourly rates quoted 1 1 2
Median hourly rate £100.00 £27.00 £21.00
Median % change year-on-year +270.37% +28.57% -
London median hourly rate £24.66 £19.50 £21.00
% change year-on-year +26.46% -7.14% -25.00%

All General Skills
Central London

Banking falls under the General Skills category. For comparison with the information above, the following table provides summary statistics for all contract job vacancies requiring common skills in Central London.

Contract vacancies with a requirement for common skills 1,406 1,610 2,396
As % of all contract IT jobs advertised in Central London 70.41% 65.82% 62.15%
Number of daily rates quoted 905 1,149 1,691
10th Percentile £330 £338 £325
25th Percentile £450 £450 £475
Median daily rate (50th Percentile) £575 £560 £600
Median % change year-on-year +2.68% -6.67% +5.26%
75th Percentile £678 £688 £738
90th Percentile £775 £800 £825
London median daily rate £575 £575 £600
% change year-on-year - -4.17% +4.35%
Number of hourly rates quoted 18 16 15
10th Percentile £22.00 £20.07 £15.20
25th Percentile £25.11 £21.93 £18.42
Median hourly rate £30.04 £24.50 £35.00
Median % change year-on-year +22.59% -30.00% -23.08%
75th Percentile £49.22 £35.69 £53.25
90th Percentile £74.63 £57.63 £58.75
London median hourly rate £34.00 £28.50 £32.00
% change year-on-year +19.30% -10.94% -12.33%

Banking
Job Vacancy Trend in Central London

Job postings citing Banking as a proportion of all IT jobs advertised in Central London.
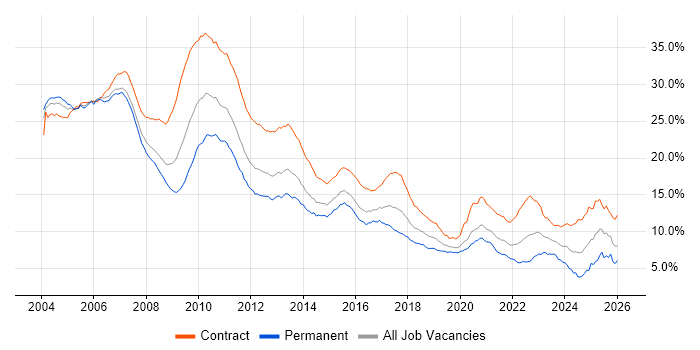
Job vacancy trend for Banking in Central London

Banking
Contractor Daily Rate Trend in Central London

3-month moving average daily rate quoted in jobs citing Banking in Central London.

Daily rate trend for Banking in Central London

Banking
Daily Rate Histogram in Central London

Daily rate distribution for jobs citing Banking in Central London over the 6 months to 1 May 2025.

Daily rate histogram for Banking in Central London

Banking
Contractor Hourly Rate Trend in Central London

3-month moving average hourly rates quoted in jobs citing Banking in Central London.

Hourly rate trend for Banking in Central London

Banking
Contract Job Locations in Central London

The table below looks at the demand and provides a guide to the median contractor rates quoted in IT jobs citing Banking within the Central London region over the 6 months to 1 May 2025. The 'Rank Change' column provides an indication of the change in demand within each location based on the same 6 month period last year.

Location Rank Change
on Same Period
Last Year
Matching
Contract
IT Job Ads
Median
Daily Rate
Past 6 Months
Median Daily Rate
% Change
on Same Period
Last Year
Live
Jobs
City of London +4 260 £600 +1.69% 76
West End of London +3 6 £600 -11.11% 9
Camden +1 2 £474 -44.24%
Southwark - 2 - -
Banking
London

Banking
Co-occurring Skills and Capabilities in Central London by Category

The follow tables expand on the table above by listing co-occurrences grouped by category. The same employment type, locality and period is covered with up to 20 co-occurrences shown in each of the following categories:

Application Platforms
1 14 (5.04%) Confluence
2 11 (3.96%) SharePoint
3 8 (2.88%) Apache Spark
4 4 (1.44%) Microsoft Exchange
5 3 (1.08%) Oracle Workflow
5 3 (1.08%) WebLogic
6 2 (0.72%) Apache
6 2 (0.72%) Apache Airflow
6 2 (0.72%) CMS
6 2 (0.72%) SAS
6 2 (0.72%) Skype for Business
7 1 (0.36%) Exchange Server 2010
Applications
1 22 (7.91%) Microsoft Excel
2 10 (3.60%) Microsoft Office
3 9 (3.24%) Microsoft PowerPoint
4 6 (2.16%) Microsoft Project
5 4 (1.44%) MS Visio
6 2 (0.72%) Spreadsheet
7 1 (0.36%) Adobe XD
7 1 (0.36%) Sketch
Business Applications
1 7 (2.52%) Dynamics CRM
2 5 (1.80%) Oracle Assets
2 5 (1.80%) Oracle General Ledger
2 5 (1.80%) Oracle Payables
2 5 (1.80%) Oracle Receivables
3 3 (1.08%) Oracle Cash Management
3 3 (1.08%) SAP S/4HANA
4 2 (0.72%) Actimize
4 2 (0.72%) ION Anvil
4 2 (0.72%) Oracle EBS
4 2 (0.72%) Oracle EBS R12
4 2 (0.72%) Oracle Financials
4 2 (0.72%) Oracle Internet Expenses
4 2 (0.72%) Oracle iProcurement
4 2 (0.72%) Oracle Procure-to-Pay
4 2 (0.72%) Salesforce CRM
4 2 (0.72%) SAP CO
4 2 (0.72%) SAP FI
4 2 (0.72%) SAP FI/CO
5 1 (0.36%) Oracle Applications
Cloud Services
1 44 (15.83%) AWS
2 40 (14.39%) Azure
3 16 (5.76%) GCP
4 15 (5.40%) Power Platform
5 13 (4.68%) Microsoft 365
6 10 (3.60%) Amazon EKS
7 8 (2.88%) Amazon S3
7 8 (2.88%) Microsoft Purview
8 7 (2.52%) Azure DevOps
8 7 (2.52%) GitHub
8 7 (2.52%) SaaS
9 6 (2.16%) Amazon EC2
9 6 (2.16%) Amazon ElastiCache
9 6 (2.16%) CloudFront
9 6 (2.16%) Dynamics 365
9 6 (2.16%) Entra ID
9 6 (2.16%) Route 53
10 4 (1.44%) OneDrive
10 4 (1.44%) Snowflake
11 3 (1.08%) Azure Sentinel
Communications & Networking
1 9 (3.24%) Firewall
2 6 (2.16%) DNS
2 6 (2.16%) TCP/IP
3 3 (1.08%) HTTP
3 3 (1.08%) SSL
3 3 (1.08%) VPN
4 2 (0.72%) DHCP
4 2 (0.72%) FTP
4 2 (0.72%) Internet
4 2 (0.72%) Kerberos
4 2 (0.72%) Skype
4 2 (0.72%) SMTP
5 1 (0.36%) ATM
5 1 (0.36%) Cisco Nexus
5 1 (0.36%) LAN
5 1 (0.36%) PBX
5 1 (0.36%) PSTN
5 1 (0.36%) SAN
5 1 (0.36%) VoIP
5 1 (0.36%) WAN
Database & Business Intelligence
1 22 (7.91%) SQL Server
2 11 (3.96%) NoSQL
3 9 (3.24%) Big Data
3 9 (3.24%) Power BI
3 9 (3.24%) Redis
4 7 (2.52%) Hadoop
4 7 (2.52%) Tableau
5 6 (2.16%) Amazon Aurora
5 6 (2.16%) Apache Hive
5 6 (2.16%) Data Warehouse
5 6 (2.16%) DocumentDB
6 5 (1.80%) MongoDB
6 5 (1.80%) Oracle Reports
7 4 (1.44%) Oracle Database
7 4 (1.44%) PostgreSQL
7 4 (1.44%) Relational Database
8 3 (1.08%) Data Lake
8 3 (1.08%) Data Mining
8 3 (1.08%) Metadata
9 2 (0.72%) DB2
Development Applications
1 30 (10.79%) JIRA
2 14 (5.04%) Jenkins
3 9 (3.24%) TeamCity
4 7 (2.52%) Git
5 6 (2.16%) Bitbucket
6 5 (1.80%) Subversion
7 3 (1.08%) GitLab
7 3 (1.08%) JUnit
7 3 (1.08%) Zephyr
8 2 (0.72%) Ant
8 2 (0.72%) Appium
8 2 (0.72%) Artifactory
8 2 (0.72%) Babel
8 2 (0.72%) Bitbucket Server
8 2 (0.72%) Oracle Forms
8 2 (0.72%) Postman
8 2 (0.72%) REST Assured
8 2 (0.72%) SonarQube
8 2 (0.72%) webpack
8 2 (0.72%) XCTest
General
1 187 (67.27%) Finance
2 82 (29.50%) Investment Banking
3 79 (28.42%) Social Skills
4 44 (15.83%) Analytical Skills
5 30 (10.79%) Front Office
6 29 (10.43%) Retail Banking
7 27 (9.71%) Financial Institution
8 18 (6.47%) Corporate Banking
9 15 (5.40%) Retail
10 10 (3.60%) International Banking
11 6 (2.16%) General Ledger
12 5 (1.80%) Back Office
12 5 (1.80%) Organisational Skills
13 4 (1.44%) Presentation Skills
14 3 (1.08%) Documentation Skills
14 3 (1.08%) Inclusion and Diversity
14 3 (1.08%) Marketing
15 2 (0.72%) Legal
15 2 (0.72%) Public Sector
16 1 (0.36%) Telecoms
Job Titles
1 54 (19.42%) Developer
2 52 (18.71%) Analyst
3 31 (11.15%) Senior
4 28 (10.07%) Business Analyst
5 20 (7.19%) Data Analyst
6 19 (6.83%) Consultant
7 16 (5.76%) Architect
8 15 (5.40%) Project Manager
9 12 (4.32%) C# Developer
9 12 (4.32%) Lead
10 11 (3.96%) Java Developer
11 10 (3.60%) Data Business Analyst
12 8 (2.88%) Data Engineer
12 8 (2.88%) Software Engineer
13 7 (2.52%) Solutions Architect
14 6 (2.16%) Angular Developer
14 6 (2.16%) Delivery Manager
14 6 (2.16%) DevOps Engineer
14 6 (2.16%) Python Developer
14 6 (2.16%) React Developer
Libraries, Frameworks & Software Standards
1 21 (7.55%) .NET
2 13 (4.68%) AngularJS
3 12 (4.32%) HTML
4 11 (3.96%) HTML5
4 11 (3.96%) PySpark
5 9 (3.24%) Spring
5 9 (3.24%) XML
6 8 (2.88%) React
6 8 (2.88%) REST
6 8 (2.88%) RESTful
7 7 (2.52%) CSS
7 7 (2.52%) JSON
7 7 (2.52%) Spring Boot
8 6 (2.16%) GraphQL
8 6 (2.16%) Web Services
9 5 (1.80%) CSS3
9 5 (1.80%) Kafka
9 5 (1.80%) TensorFlow
9 5 (1.80%) WPF
10 4 (1.44%) SOAP
Miscellaneous
1 15 (5.40%) Derivative
1 15 (5.40%) Foreign Exchange (FX)
2 12 (4.32%) Fixed Income
3 11 (3.96%) Legacy Systems
3 11 (3.96%) Public Cloud
4 10 (3.60%) Equities
4 10 (3.60%) Onboarding
5 9 (3.24%) Credit Risk
6 7 (2.52%) Product Ownership
7 5 (1.80%) Analytical Mindset
7 5 (1.80%) Mainframe
7 5 (1.80%) SWIFT Messaging Network
8 4 (1.44%) Algorithms
8 4 (1.44%) Distributed Systems
8 4 (1.44%) Greenfield Project
8 4 (1.44%) Low-Code
8 4 (1.44%) Management Information System
9 3 (1.08%) Clustering
9 3 (1.08%) Market Risk
9 3 (1.08%) Replication
Operating Systems
1 25 (8.99%) Windows
2 12 (4.32%) Linux
3 10 (3.60%) Windows Server
4 5 (1.80%) Apple iOS
4 5 (1.80%) Unix
5 4 (1.44%) Windows 10
6 3 (1.08%) Windows Server 2016
7 2 (0.72%) Android
7 2 (0.72%) Mac OS
7 2 (0.72%) Solaris
8 1 (0.36%) CentOS
8 1 (0.36%) Red Hat Enterprise Linux
Processes & Methodologies
1 58 (20.86%) Problem-Solving
2 57 (20.50%) Agile
3 43 (15.47%) Stakeholder Management
4 31 (11.15%) Analytics
5 28 (10.07%) Risk Management
6 26 (9.35%) DevOps
7 25 (8.99%) Project Management
8 23 (8.27%) CI/CD
9 22 (7.91%) Cybersecurity
10 20 (7.19%) Migration
10 20 (7.19%) SDLC
11 19 (6.83%) Data Analysis
12 18 (6.47%) Wealth Management
13 17 (6.12%) Decision-Making
13 17 (6.12%) Software Engineering
14 16 (5.76%) Microservices
15 15 (5.40%) Roadmaps
16 14 (5.04%) Requirements Gathering
16 14 (5.04%) User Experience
17 13 (4.68%) Fintech
Programming Languages
1 55 (19.78%) SQL
2 45 (16.19%) Python
3 30 (10.79%) Java
4 29 (10.43%) C#
5 15 (5.40%) JavaScript
6 13 (4.68%) TypeScript
7 11 (3.96%) PowerShell
8 6 (2.16%) PL/SQL
9 4 (1.44%) C++
10 3 (1.08%) Bash
10 3 (1.08%) Groovy
10 3 (1.08%) Scala
10 3 (1.08%) T-SQL
10 3 (1.08%) VBA
11 2 (0.72%) COBOL
11 2 (0.72%) Perl
11 2 (0.72%) R
11 2 (0.72%) REXX
11 2 (0.72%) Ruby
11 2 (0.72%) Shell Script
Qualifications
1 28 (10.07%) Degree
2 12 (4.32%) Master's Degree
3 6 (2.16%) PhD
3 6 (2.16%) PMI Certification
3 6 (2.16%) PMP
3 6 (2.16%) Security Cleared
4 5 (1.80%) Computer Science Degree
5 4 (1.44%) Azure Certification
5 4 (1.44%) SC Cleared
6 3 (1.08%) CBAP
6 3 (1.08%) CISSP
7 2 (0.72%) AWS Certification
7 2 (0.72%) AWS Certified Solutions Architect
7 2 (0.72%) CCNP
7 2 (0.72%) CFA
7 2 (0.72%) Cisco Certification
7 2 (0.72%) CISM
7 2 (0.72%) MBA
7 2 (0.72%) Microsoft Certification
7 2 (0.72%) PRINCE2 Certification
Quality Assurance & Compliance
1 9 (3.24%) MiFID
2 8 (2.88%) Data Quality
3 6 (2.16%) PMO
3 6 (2.16%) QA
4 5 (1.80%) EMIR
4 5 (1.80%) GDPR
5 4 (1.44%) Accessibility
6 3 (1.08%) Basel II
6 3 (1.08%) ISO/IEC 27001
6 3 (1.08%) NIST
6 3 (1.08%) Sarbanes-Oxley
6 3 (1.08%) SEPA
7 2 (0.72%) COBIT
7 2 (0.72%) Dodd-Frank
8 1 (0.36%) GRC
8 1 (0.36%) IFRS
8 1 (0.36%) IFRS 9
8 1 (0.36%) ISO 20022
8 1 (0.36%) ITGC
8 1 (0.36%) PSD2
System Software
1 10 (3.60%) Active Directory
2 9 (3.24%) Docker
3 5 (1.80%) VMware Infrastructure
4 4 (1.44%) Hyper-V
4 4 (1.44%) VMware ESXi
5 3 (1.08%) XenDesktop
6 2 (0.72%) BitLocker
6 2 (0.72%) Lustre
6 2 (0.72%) Virtual Desktop
7 1 (0.36%) HDFS
7 1 (0.36%) Microsoft App-V
7 1 (0.36%) NFS
7 1 (0.36%) Oracle RAC
7 1 (0.36%) Veritas File System
7 1 (0.36%) Veritas Volume Manager
7 1 (0.36%) Virtual Servers
7 1 (0.36%) XenApp
7 1 (0.36%) XYGATE
Systems Management
1 12 (4.32%) Kubernetes
2 8 (2.88%) Terraform
3 7 (2.52%) Ansible
4 6 (2.16%) Microsoft Intune
5 5 (1.80%) SCCM
6 3 (1.08%) Grafana
7 2 (0.72%) Active Directory Federation Services
7 2 (0.72%) CASB
7 2 (0.72%) Control-M
7 2 (0.72%) Forefront Identity Manager
7 2 (0.72%) HP ALM
7 2 (0.72%) Karpenter
7 2 (0.72%) Podman
7 2 (0.72%) Prometheus
7 2 (0.72%) QRadar
7 2 (0.72%) Tivoli
8 1 (0.36%) Data Guard
8 1 (0.36%) Netcool
8 1 (0.36%) Tivoli Storage Manager
8 1 (0.36%) WSUS
Vendors
1 37 (13.31%) Microsoft
2 21 (7.55%) Oracle
3 9 (3.24%) Citrix
4 8 (2.88%) Splunk
5 7 (2.52%) Cisco
5 7 (2.52%) ServiceNow
5 7 (2.52%) VMware
5 7 (2.52%) Zscaler
6 6 (2.16%) Google
6 6 (2.16%) SAP
7 5 (1.80%) CyberArk
7 5 (1.80%) Databricks
7 5 (1.80%) Red Hat
8 4 (1.44%) HP
8 4 (1.44%) Planview
8 4 (1.44%) Salesforce
9 3 (1.08%) Adobe
9 3 (1.08%) IBM
9 3 (1.08%) ION Trading
9 3 (1.08%) Logitech