Migration Contracts in Central London

Migration
London > Central London

The table below provides summary statistics for contract job vacancies advertised in Central London requiring Migration skills. It includes a benchmarking guide to the contractor rates offered in vacancies that cited Migration over the 6 months leading up to 2 July 2025, comparing them to the same period in the previous two years.

6 months to
2 Jul 2025
Same period 2024 Same period 2023
Rank 19 19 22
Rank change year-on-year 0 +3 -4
Contract jobs citing Migration 190 201 301
As % of all contract jobs advertised in Central London 9.64% 8.50% 8.12%
As % of the Processes & Methodologies category 10.30% 9.32% 8.93%
Number of daily rates quoted 117 145 202
10th Percentile £364 £363 £400
25th Percentile £441 £463 £495
Median daily rate (50th Percentile) £550 £550 £625
Median % change year-on-year - -12.00% +15.74%
75th Percentile £685 £645 £738
90th Percentile £756 £708 £824
London median daily rate £550 £540 £600
% change year-on-year +1.85% -10.00% +9.09%
Number of hourly rates quoted 1 0 0
10th Percentile - - -
25th Percentile £34.63 - -
Median hourly rate £34.65 - -
75th Percentile £34.68 - -
90th Percentile - - -
London median hourly rate £25.15 £56.87 £52.50
% change year-on-year -55.77% +8.31% -4.55%

All Process and Methodology Skills
Central London

Migration falls under the Processes and Methodologies category. For comparison with the information above, the following table provides summary statistics for all contract job vacancies requiring process or methodology skills in Central London.

Contract vacancies with a requirement for process or methodology skills 1,844 2,156 3,372
As % of all contract IT jobs advertised in Central London 93.56% 91.20% 90.96%
Number of daily rates quoted 1,194 1,513 2,267
10th Percentile £350 £361 £325
25th Percentile £450 £456 £463
Median daily rate (50th Percentile) £550 £560 £600
Median % change year-on-year -1.79% -6.67% +5.26%
75th Percentile £675 £688 £725
90th Percentile £775 £800 £825
London median daily rate £550 £550 £588
% change year-on-year - -6.38% +2.17%
Number of hourly rates quoted 31 23 27
10th Percentile £22.00 £20.22 £14.25
25th Percentile £24.66 £22.50 £17.56
Median hourly rate £31.00 £27.81 £35.00
Median % change year-on-year +11.47% -20.54% -18.13%
75th Percentile £49.75 £36.50 £53.38
90th Percentile £63.75 £48.57 £88.30
London median hourly rate £32.25 £30.00 £40.50
% change year-on-year +7.50% -25.93% +12.50%

Migration
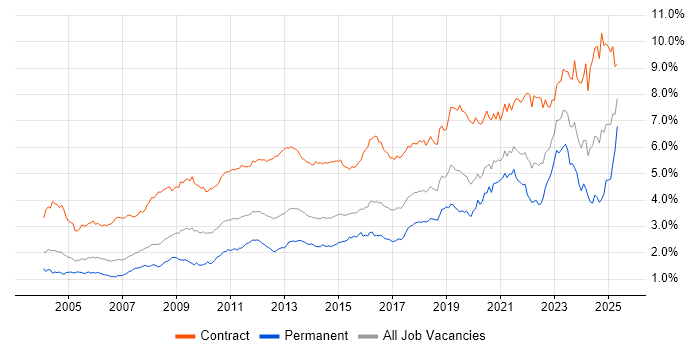
Job Vacancy Trend in Central London

Job postings citing Migration as a proportion of all IT jobs advertised in Central London.

Job vacancy trend for Migration in Central London

Migration
Contractor Daily Rate Trend in Central London

3-month moving average daily rate quoted in jobs citing Migration in Central London.

Daily rate trend for Migration in Central London

Migration
Daily Rate Histogram in Central London

Daily rate distribution for jobs citing Migration in Central London over the 6 months to 2 July 2025.

Daily rate histogram for Migration in Central London

Migration
Contractor Hourly Rate Trend in Central London

3-month moving average hourly rates quoted in jobs citing Migration in Central London.

Hourly rate trend for Migration in Central London

Migration
Contract Job Locations in Central London

The table below looks at the demand and provides a guide to the median contractor rates quoted in IT jobs citing Migration within the Central London region over the 6 months to 2 July 2025. The 'Rank Change' column provides an indication of the change in demand within each location based on the same 6 month period last year.

Location Rank Change
on Same Period
Last Year
Matching
Contract
IT Job Ads
Median
Daily Rate
Past 6 Months
Median Daily Rate
% Change
on Same Period
Last Year
Live
Jobs
City of London -1 166 £550 - 253
City of Westminster +6 9 £600 +4.35% 11
West End of London +1 7 £600 +41.18% 8
Camden +4 2 £449 -38.44% 1
Southwark - 1 £450 -
Migration
London

Migration
Co-occurring Skills and Capabilities in Central London by Category

The follow tables expand on the table above by listing co-occurrences grouped by category. The same employment type, locality and period is covered with up to 20 co-occurrences shown in each of the following categories:

Application Platforms
1 10 (5.26%) Confluence
1 10 (5.26%) SharePoint
2 5 (2.63%) CMS
3 3 (1.58%) SAS
4 2 (1.05%) Apache
4 2 (1.05%) Microsoft Exchange
5 1 (0.53%) Adobe Experience Manager
5 1 (0.53%) Documentum
5 1 (0.53%) nginx
5 1 (0.53%) Oracle Workflow
5 1 (0.53%) Umbraco
Applications
1 10 (5.26%) Microsoft Excel
2 4 (2.11%) Microsoft Office
3 1 (0.53%) Microsoft PowerPoint
3 1 (0.53%) Microsoft Project
3 1 (0.53%) MS Visio
3 1 (0.53%) Spreadsheet
Business Applications
1 5 (2.63%) Dynamics CRM
2 4 (2.11%) Oracle EBS
3 2 (1.05%) Oracle ERP
3 2 (1.05%) Oracle Payroll
3 2 (1.05%) Sage X3
3 2 (1.05%) SAP S/4HANA
4 1 (0.53%) Aladdin
4 1 (0.53%) Magento
4 1 (0.53%) Oracle BPM
4 1 (0.53%) Oracle E-Business Tax
4 1 (0.53%) Oracle Procure-to-Pay
4 1 (0.53%) Orchestrade
4 1 (0.53%) SAP CO
4 1 (0.53%) SAP FI
4 1 (0.53%) SAP FI/CO
4 1 (0.53%) SAP HR
4 1 (0.53%) Unit4 Business World
Cloud Services
1 53 (27.89%) Azure
2 30 (15.79%) AWS
3 15 (7.89%) SaaS
4 14 (7.37%) Microsoft 365
4 14 (7.37%) Power Platform
5 13 (6.84%) GCP
6 9 (4.74%) IaaS
7 7 (3.68%) Azure ExpressRoute
7 7 (3.68%) PaaS
8 6 (3.16%) Dynamics 365
8 6 (3.16%) Entra ID
9 5 (2.63%) Azure DevOps
9 5 (2.63%) Cloud Computing
9 5 (2.63%) OCI
10 4 (2.11%) Azure Data Factory
10 4 (2.11%) PowerApps
10 4 (2.11%) Serverless
10 4 (2.11%) Snowflake
11 3 (1.58%) Collibra
11 3 (1.58%) Power Automate
Communications & Networking
1 18 (9.47%) Firewall
2 13 (6.84%) DNS
2 13 (6.84%) VPN
3 7 (3.68%) NGFW
4 5 (2.63%) Network Security
5 4 (2.11%) DHCP
5 4 (2.11%) VLAN
6 2 (1.05%) BGP
6 2 (1.05%) Cisco Nexus
6 2 (1.05%) LAN
7 1 (0.53%) Cisco ASA
7 1 (0.53%) Cisco IOS
7 1 (0.53%) HSRP
7 1 (0.53%) Multicast
7 1 (0.53%) NetScaler
7 1 (0.53%) NX-OS
7 1 (0.53%) OSPF
7 1 (0.53%) Software-Defined Networking
7 1 (0.53%) Wireless Security
7 1 (0.53%) WLAN
Database & Business Intelligence
1 10 (5.26%) Data Warehouse
2 9 (4.74%) Power BI
3 5 (2.63%) SQL Server
3 5 (2.63%) Tableau
4 4 (2.11%) Metadata
5 3 (1.58%) Azure SQL Database
5 3 (1.58%) Base SAS
5 3 (1.58%) Big Data
5 3 (1.58%) BigQuery
5 3 (1.58%) Data Lake
6 2 (1.05%) NoSQL
6 2 (1.05%) Relational Database
6 2 (1.05%) Snowflake Schema
6 2 (1.05%) SQL Server Integration Services
6 2 (1.05%) Tableau Server
7 1 (0.53%) Amazon Athena
7 1 (0.53%) Apache Iceberg
7 1 (0.53%) Looker
7 1 (0.53%) Metadata Repository
7 1 (0.53%) Power Query
Development Applications
1 12 (6.32%) JIRA
2 6 (3.16%) GitLab
3 4 (2.11%) ScriptRunner
4 3 (1.58%) Git
5 2 (1.05%) Jenkins
5 2 (1.05%) SonarQube
5 2 (1.05%) Zephyr
6 1 (0.53%) ER Studio
6 1 (0.53%) Gradle
6 1 (0.53%) JIRA Agile
6 1 (0.53%) LoadRunner
6 1 (0.53%) Maven
6 1 (0.53%) Selenium
6 1 (0.53%) Travis CI
General
1 84 (44.21%) Finance
2 45 (23.68%) Social Skills
3 23 (12.11%) Banking
4 14 (7.37%) Analytical Skills
5 8 (4.21%) Inclusion and Diversity
6 6 (3.16%) Legal
6 6 (3.16%) Organisational Skills
7 5 (2.63%) Documentation Skills
7 5 (2.63%) Front Office
7 5 (2.63%) Marketing
7 5 (2.63%) Public Sector
8 4 (2.11%) Law
8 4 (2.11%) Retail
9 3 (1.58%) General Ledger
9 3 (1.58%) Investment Banking
9 3 (1.58%) Presentation Skills
10 2 (1.05%) Back Office
10 2 (1.05%) Financial Institution
10 2 (1.05%) French Language
10 2 (1.05%) International Banking
Job Titles
1 38 (20.00%) Architect
2 35 (18.42%) Analyst
3 19 (10.00%) Project Manager
4 16 (8.42%) Solutions Architect
5 15 (7.89%) Developer
5 15 (7.89%) Senior
6 14 (7.37%) Data Analyst
7 11 (5.79%) Azure Engineer
7 11 (5.79%) Business Analyst
8 10 (5.26%) Consultant
8 10 (5.26%) Lead
8 10 (5.26%) Network Engineer
9 8 (4.21%) Azure Architect
9 8 (4.21%) Data Architect
9 8 (4.21%) Support Engineer
9 8 (4.21%) Windows Engineer
10 7 (3.68%) Data Engineer
10 7 (3.68%) Network Support
10 7 (3.68%) Network Support Engineer
11 6 (3.16%) Security Architect
Libraries, Frameworks & Software Standards
1 7 (3.68%) ADO
2 6 (3.16%) REST
3 5 (2.63%) .NET
4 3 (1.58%) CSS
4 3 (1.58%) HTML
4 3 (1.58%) HTML5 Canvas
4 3 (1.58%) Lightning Web Components
4 3 (1.58%) Oracle Fusion
4 3 (1.58%) SOAP
4 3 (1.58%) Spring Boot
4 3 (1.58%) Visualforce
4 3 (1.58%) XML
5 2 (1.05%) ARM Templates
5 2 (1.05%) Azure Blueprints
5 2 (1.05%) JSON
5 2 (1.05%) Middleware
5 2 (1.05%) Spring
6 1 (0.53%) FpML
6 1 (0.53%) SAP Basis
6 1 (0.53%) Web Services
Miscellaneous
1 12 (6.32%) Data Centre
2 10 (5.26%) Cloud Native
3 7 (3.68%) Anti-Spyware
4 5 (2.63%) Foreign Exchange (FX)
4 5 (2.63%) Legacy Systems
4 5 (2.63%) Management Information System
4 5 (2.63%) Private Cloud
5 4 (2.11%) Reinsurance
6 3 (1.58%) Cyber Threat
6 3 (1.58%) Distributed Denial-of-Service
6 3 (1.58%) Greenfield Project
6 3 (1.58%) Mainframe
6 3 (1.58%) Public Cloud
7 2 (1.05%) Data Structures
7 2 (1.05%) Fixed Income
7 2 (1.05%) Hybrid Cloud
7 2 (1.05%) iSeries
7 2 (1.05%) PKI
7 2 (1.05%) Smart Meter
7 2 (1.05%) SWIFT Messaging Network
Operating Systems
1 28 (14.74%) Windows
2 15 (7.89%) Linux
3 7 (3.68%) Windows Server
4 5 (2.63%) Windows 10
5 4 (2.11%) Unix
6 3 (1.58%) AIX
6 3 (1.58%) Oracle Linux
7 1 (0.53%) Android
7 1 (0.53%) Apple iOS
7 1 (0.53%) Red Hat Enterprise Linux
Processes & Methodologies
1 45 (23.68%) Data Migration
2 40 (21.05%) Problem-Solving
3 36 (18.95%) Agile
4 25 (13.16%) Stakeholder Management
5 21 (11.05%) DevOps
6 18 (9.47%) Project Management
7 17 (8.95%) User Acceptance Testing
8 16 (8.42%) Data Cleansing
9 15 (7.89%) CI/CD
9 15 (7.89%) Data Modelling
10 14 (7.37%) Infrastructure as Code
11 12 (6.32%) Validation
12 11 (5.79%) Business Intelligence
12 11 (5.79%) Kalman Filter
12 11 (5.79%) Project Delivery
12 11 (5.79%) Stakeholder Engagement
13 10 (5.26%) Data Analysis
13 10 (5.26%) ERP
13 10 (5.26%) Test Automation
14 9 (4.74%) Change Management
Programming Languages
1 28 (14.74%) SQL
2 22 (11.58%) Python
3 13 (6.84%) Java
3 13 (6.84%) PowerShell
4 8 (4.21%) JavaScript
5 4 (2.11%) Bash
5 4 (2.11%) C#
5 4 (2.11%) Groovy
6 3 (1.58%) Apex Code
6 3 (1.58%) Bicep
6 3 (1.58%) VBScript
7 2 (1.05%) C++
7 2 (1.05%) PL/SQL
7 2 (1.05%) PROC SQL
7 2 (1.05%) Ruby
7 2 (1.05%) SAS Macro
7 2 (1.05%) VBA
8 1 (0.53%) Shell Script
8 1 (0.53%) SOQL
8 1 (0.53%) T-SQL
Qualifications
1 16 (8.42%) Degree
2 15 (7.89%) Security Cleared
3 13 (6.84%) SC Cleared
4 6 (3.16%) Cisco Certification
5 4 (2.11%) AWS Certification
6 3 (1.58%) CBAP
6 3 (1.58%) CCNP
7 2 (1.05%) (ISC)2 CCSP
7 2 (1.05%) Azure Certification
7 2 (1.05%) CASP
7 2 (1.05%) CCSP
7 2 (1.05%) CISSP
7 2 (1.05%) Computer Science Degree
7 2 (1.05%) CREST Certified
7 2 (1.05%) CSSLP
7 2 (1.05%) GIAC
7 2 (1.05%) PMP
8 1 (0.53%) AWS Certified Solutions Architect
8 1 (0.53%) BPSS Clearance
8 1 (0.53%) TOGAF Certification
Quality Assurance & Compliance
1 13 (6.84%) Data Quality
2 6 (3.16%) GDPR
2 6 (3.16%) QA
3 3 (1.58%) Accessibility
3 3 (1.58%) ISO/IEC 27001
3 3 (1.58%) NIST
3 3 (1.58%) SEPA
4 2 (1.05%) HIPAA
4 2 (1.05%) HMG Security Policy Framework
4 2 (1.05%) NCSC
4 2 (1.05%) SOC 2
5 1 (0.53%) Cyber Essentials
5 1 (0.53%) GAAP
5 1 (0.53%) ISO 20022
5 1 (0.53%) ISO 9001
5 1 (0.53%) PMO
5 1 (0.53%) Sarbanes-Oxley
5 1 (0.53%) SLA
System Software
1 12 (6.32%) Active Directory
2 3 (1.58%) Docker
2 3 (1.58%) Virtual Machines
3 2 (1.05%) Hyper-V
3 2 (1.05%) Microsoft App-V
4 1 (0.53%) BitLocker
4 1 (0.53%) Firmware
Systems Management
1 17 (8.95%) Terraform
2 4 (2.11%) SCCM
3 3 (1.58%) Ansible
3 3 (1.58%) Kubernetes
3 3 (1.58%) Microsoft Intune
3 3 (1.58%) Puppet
4 2 (1.05%) Opsgenie
4 2 (1.05%) SELinux
5 1 (0.53%) Argo
5 1 (0.53%) CA Spectrum
5 1 (0.53%) CEMLI
5 1 (0.53%) Cisco LMS
5 1 (0.53%) Cisco Prime
5 1 (0.53%) Grafana
5 1 (0.53%) Istio
5 1 (0.53%) Netcool
5 1 (0.53%) Podman
5 1 (0.53%) Progress Chef
5 1 (0.53%) Prometheus
Vendors
1 32 (16.84%) Microsoft
2 17 (8.95%) Oracle
3 12 (6.32%) SAP
4 9 (4.74%) Palo Alto
5 8 (4.21%) CheckPoint
6 7 (3.68%) Infoblox
7 5 (2.63%) Cisco
7 5 (2.63%) Google
7 5 (2.63%) VMware
8 4 (2.11%) Atlassian
8 4 (2.11%) Bloomberg
8 4 (2.11%) Salesforce
9 3 (1.58%) Adobe
9 3 (1.58%) Citrix
9 3 (1.58%) Guidewire
9 3 (1.58%) IBM
9 3 (1.58%) Murex
9 3 (1.58%) Splunk
9 3 (1.58%) Tradeweb
10 2 (1.05%) Informatica