VMware Contracts in the City of London

VMware
Central London > City of London

The table below provides summary statistics for contract job vacancies advertised in the City of London requiring knowledge or experience of VMware products and/or services. It includes a benchmarking guide to contractor rates offered in vacancies that cited VMware over the 6 months leading up to 29 August 2025, comparing them to the same period in the previous two years.

The figures below represent the IT contractor job market in general and are not representative of contractor rates within VMware, Inc.

6 months to
29 Aug 2025
Same period 2024 Same period 2023
Rank 103 81 77
Rank change year-on-year -22 -4 +38
Contract jobs citing VMware 19 42 98
As % of all contract jobs advertised in the City of London 1.06% 2.02% 3.09%
As % of the Vendors category 2.17% 4.56% 7.44%
Number of daily rates quoted 15 28 66
10th Percentile £344 £319 £372
25th Percentile £488 £443 £450
Median daily rate (50th Percentile) £525 £523 £525
Median % change year-on-year +0.48% -0.48% -
75th Percentile £624 £643 £631
90th Percentile £685 £708 £694
Central London median daily rate £525 £520 £525
% change year-on-year +0.96% -0.95% +5.00%
Number of hourly rates quoted 0 0 2
10th Percentile - - £23.88
25th Percentile - - £27.81
Median hourly rate - - £36.25
75th Percentile - - £45.31
90th Percentile - - £49.63
Central London median hourly rate - - £36.25
% change year-on-year - - +18.85%

All Vendors
City of London

VMware falls under the Vendor Products and Services category. For comparison with the information above, the following table provides summary statistics for all contract job vacancies requiring knowledge or experience of all vendor products and services in the City of London.

Contract vacancies with a requirement for knowledge or experience of vendor products and services 877 921 1,318
As % of all contract IT jobs advertised in the City of London 48.72% 44.34% 41.58%
Number of daily rates quoted 572 619 910
10th Percentile £316 £348 £299
25th Percentile £413 £450 £450
Median daily rate (50th Percentile) £550 £550 £550
75th Percentile £675 £675 £689
90th Percentile £750 £762 £790
Central London median daily rate £536 £550 £550
% change year-on-year -2.55% - -
Number of hourly rates quoted 13 11 6
10th Percentile £20.23 £16.00 £14.43
25th Percentile £23.75 £19.50 £17.77
Median hourly rate £34.65 £27.00 £36.25
Median % change year-on-year +28.33% -25.52% +37.21%
75th Percentile £63.75 £115.00 £52.88
90th Percentile £65.21 £137.50 £65.25
Central London median hourly rate £29.07 £27.00 £36.25
% change year-on-year +7.67% -25.52% +36.79%

VMware
Job Vacancy Trend in the City of London

Job postings citing VMware as a proportion of all IT jobs advertised in the City of London.
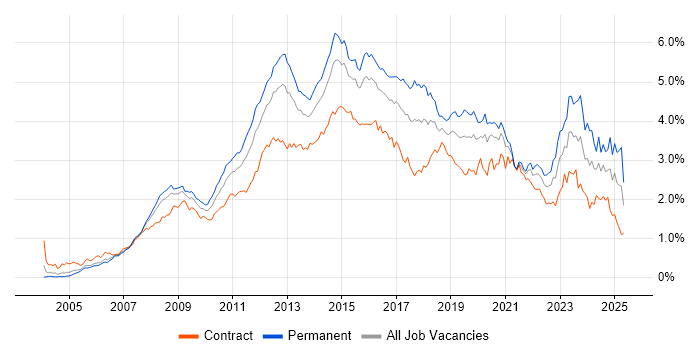
Job vacancy trend for VMware in the City of London

VMware
Daily Rate Trend in the City of London

Contractor daily rate distribution trend for jobs in the City of London citing VMware.

Contractor daily rate distribution trend for jobs in the City of London citing VMware

VMware
Daily Rate Histogram in the City of London

Daily rate distribution for jobs citing VMware in the City of London over the 6 months to 29 August 2025.

Daily rate histogram for VMware in the City of London

VMware
Hourly Rate Trend in the City of London

Contractor hourly rate distribution trend for jobs in the City of London citing VMware.

Contractor hourly rate distribution trend for jobs in the City of London citing VMware

VMware
Co-occurring Skills and Capabilities in the City of London by Category

The follow tables expand on the table above by listing co-occurrences grouped by category. The same employment type, locality and period is covered with up to 20 co-occurrences shown in each of the following categories:

Cloud Services
1 5 (26.32%) Azure
2 2 (10.53%) AWS
2 2 (10.53%) GCP
2 2 (10.53%) Microsoft 365
3 1 (5.26%) Amazon EC2
3 1 (5.26%) Azure ExpressRoute
3 1 (5.26%) Entra ID
Communications & Networking
1 5 (26.32%) DNS
2 4 (21.05%) DHCP
2 4 (21.05%) Firewall
3 3 (15.79%) Wi-Fi
4 2 (10.53%) LAN
4 2 (10.53%) Network Security
4 2 (10.53%) VSAN
4 2 (10.53%) WAN
5 1 (5.26%) BGP
5 1 (5.26%) MPLS
5 1 (5.26%) OSPF
5 1 (5.26%) SAN
5 1 (5.26%) SD-WAN
5 1 (5.26%) Software-Defined Networking
5 1 (5.26%) TCP/IP
5 1 (5.26%) VLAN
5 1 (5.26%) VPN
Database & Business Intelligence
1 2 (10.53%) SQL Server
2 1 (5.26%) Amazon RDS
2 1 (5.26%) Oracle Database
General
1 7 (36.84%) Finance
2 4 (21.05%) Analytical Skills
3 3 (15.79%) Social Skills
4 2 (10.53%) Telecoms
5 1 (5.26%) Banking
5 1 (5.26%) Front Office
5 1 (5.26%) Inclusion and Diversity
5 1 (5.26%) Legal
5 1 (5.26%) Presentation Skills
Job Titles
1 3 (15.79%) Analyst
1 3 (15.79%) Infrastructure Engineer
1 3 (15.79%) Operations Analyst
1 3 (15.79%) Security Analyst
1 3 (15.79%) Security Operations Analyst
1 3 (15.79%) VMware Engineer
2 2 (10.53%) VMware Infrastructure Engineer
3 1 (5.26%) Applications Engineer
3 1 (5.26%) Azure Engineer
3 1 (5.26%) Azure Infrastructure Engineer
3 1 (5.26%) Hyper-V Engineer
3 1 (5.26%) IT Engineer
3 1 (5.26%) Junior Desktop Engineer
3 1 (5.26%) Junior Desktop Support
3 1 (5.26%) Junior Desktop Support Engineer
3 1 (5.26%) Network Security Architect
3 1 (5.26%) Subject Matter Expert
3 1 (5.26%) Technology Director
3 1 (5.26%) Windows Engineer
3 1 (5.26%) Windows Infrastructure Engineer
Miscellaneous
1 3 (15.79%) Cyber Threat
1 3 (15.79%) Distributed Denial-of-Service
2 2 (10.53%) Clustering
2 2 (10.53%) Data Centre
3 1 (5.26%) Enterprise Storage
3 1 (5.26%) Fat Client
3 1 (5.26%) HP Storage
3 1 (5.26%) Hybrid Cloud
3 1 (5.26%) Private Cloud
3 1 (5.26%) Thin Client
Operating Systems
1 13 (68.42%) Windows
2 6 (31.58%) Windows Server
3 5 (26.32%) Linux
4 2 (10.53%) Windows 10
4 2 (10.53%) Windows Server 2016
4 2 (10.53%) Windows Server 2019
5 1 (5.26%) Apple iOS
5 1 (5.26%) Mac OS
5 1 (5.26%) Windows Server 2012
Processes & Methodologies
1 7 (36.84%) Problem-Solving
2 5 (26.32%) ITIL
3 4 (21.05%) Cybersecurity
3 4 (21.05%) Migration
3 4 (21.05%) SIEM
3 4 (21.05%) SOAR
4 3 (15.79%) Disaster Recovery
4 3 (15.79%) Incident Response
4 3 (15.79%) Infrastructure Engineering
4 3 (15.79%) Security Operations
4 3 (15.79%) Threat Modelling
5 2 (10.53%) Data Centre Operations
5 2 (10.53%) Incident Management
5 2 (10.53%) Infrastructure Management
5 2 (10.53%) Security Patching
5 2 (10.53%) Service Delivery
5 2 (10.53%) Software Deployment
5 2 (10.53%) Task Automation
5 2 (10.53%) Tech Ops
5 2 (10.53%) Technical Leadership
Programming Languages
1 7 (36.84%) Python
2 6 (31.58%) PowerShell
3 3 (15.79%) Bash
4 2 (10.53%) Java
Qualifications
1 2 (10.53%) Degree
1 2 (10.53%) SC Cleared
1 2 (10.53%) Security Cleared
2 1 (5.26%) CCNA
2 1 (5.26%) CCNP
2 1 (5.26%) Cisco Certification
2 1 (5.26%) ITIL Certification
2 1 (5.26%) MCSA
2 1 (5.26%) Microsoft Certification
2 1 (5.26%) VCAP
2 1 (5.26%) VMware Certified Professional (VCP)
Quality Assurance & Compliance
1 1 (5.26%) ISO/IEC 27001
1 1 (5.26%) NIST
1 1 (5.26%) PCI DSS
System Software
1 11 (57.89%) Active Directory
2 7 (36.84%) VMware Infrastructure
3 4 (21.05%) Hyper-V
4 3 (15.79%) VMware NSX
5 1 (5.26%) Firmware
5 1 (5.26%) VMware ESXi
5 1 (5.26%) vSphere
Systems Management
1 2 (10.53%) Symantec Endpoint Protection
2 1 (5.26%) FortiGate
2 1 (5.26%) Microsoft Intune
2 1 (5.26%) SCCM
2 1 (5.26%) Terraform
2 1 (5.26%) vCenter Server
2 1 (5.26%) vMotion
Vendors
1 7 (36.84%) Microsoft
2 5 (26.32%) Citrix
3 4 (21.05%) Cisco
4 3 (15.79%) Palo Alto
4 3 (15.79%) Splunk
5 2 (10.53%) Altiris
5 2 (10.53%) CyberArk
5 2 (10.53%) Dell
5 2 (10.53%) Fortinet
5 2 (10.53%) Ivanti
5 2 (10.53%) Symantec
6 1 (5.26%) Atempo
6 1 (5.26%) Avaya
6 1 (5.26%) CheckPoint
6 1 (5.26%) Google
6 1 (5.26%) HP
6 1 (5.26%) Infoblox
6 1 (5.26%) Juniper
6 1 (5.26%) Oracle
6 1 (5.26%) Sun