Mimecast Contracts

Mimecast
UK

The following table provides summary statistics for contract job vacancies with a requirement for Mimecast skills. Included is a benchmarking guide to the contractor rates offered in vacancies that have cited Mimecast over the 6 months to 11 May 2024 with a comparison to the same period in the previous 2 years.

6 months to
11 May 2024
Same period 2023 Same period 2022
Rank 541 633 749
Rank change year-on-year +92 +116 -107
Contract jobs citing Mimecast 49 66 95
As % of all contract jobs advertised in the UK 0.11% 0.11% 0.11%
As % of the Cloud Services category 0.35% 0.31% 0.28%
Number of daily rates quoted 27 42 77
10th Percentile £300 £181 £158
25th Percentile £375 £316 £159
Median daily rate (50th Percentile) £413 £450 £485
Median % change year-on-year -8.33% -7.22% +21.25%
75th Percentile £525 £555 £550
90th Percentile £638 £600 £688
UK excluding London median daily rate £400 £375 £184
% change year-on-year +6.67% +104.08% -51.80%
Number of hourly rates quoted 4 3 3
10th Percentile £16.70 - -
25th Percentile £17.38 £16.25 £16.25
Median hourly rate £21.15 £17.50 £17.50
Median % change year-on-year +20.86% - -
75th Percentile £23.80 £18.75 £28.13
90th Percentile - - £33.75
UK excluding London median hourly rate £18.00 £17.50 £17.50
% change year-on-year +2.86% - -

All Cloud Skills
UK

Mimecast is in the Cloud Services category. The following table is for comparison with the above and provides summary statistics for all contract job vacancies with a requirement for cloud computing skills.

Contract vacancies with a requirement for cloud computing skills 13,933 21,254 33,724
As % of all contract IT jobs advertised in the UK 32.40% 36.77% 38.57%
Number of daily rates quoted 9,906 15,370 24,584
10th Percentile £300 £325 £350
25th Percentile £413 £450 £450
Median daily rate (50th Percentile) £525 £550 £550
Median % change year-on-year -4.55% - +10.00%
75th Percentile £634 £650 £650
90th Percentile £738 £745 £738
UK excluding London median daily rate £488 £500 £500
% change year-on-year -2.50% - +11.11%
Number of hourly rates quoted 345 348 423
10th Percentile £14.00 £15.25 £13.88
25th Percentile £16.00 £18.25 £15.35
Median hourly rate £21.37 £35.00 £22.40
Median % change year-on-year -38.94% +56.25% -0.44%
75th Percentile £35.00 £66.00 £54.63
90th Percentile £64.45 £78.00 £67.40
UK excluding London median hourly rate £17.71 £25.00 £20.00
% change year-on-year -29.18% +25.00% -

Mimecast
Job Vacancy Trend

Job postings citing Mimecast as a proportion of all IT jobs advertised.
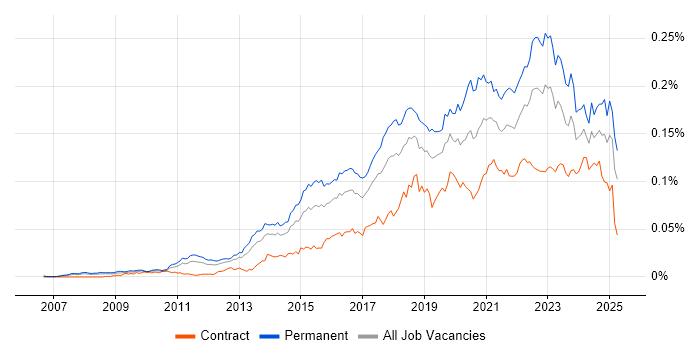
Job vacancy trend for Mimecast in the UK

Mimecast
Contractor Daily Rate Trend

3-month moving average daily rate quoted in jobs citing Mimecast.

Daily rate trend for Mimecast in the UK

Mimecast
Daily Rate Histogram

Daily rate distribution for jobs citing Mimecast over the 6 months to 11 May 2024.

Daily rate histogram for Mimecast in the UK

Mimecast
Contractor Hourly Rate Trend

3-month moving average hourly rates quoted in jobs citing Mimecast.

Hourly rate trend for Mimecast in the UK

Mimecast
Top 9 Contract Locations

The table below looks at the demand and provides a guide to the median contractor rates quoted in IT jobs citing Mimecast within the UK over the 6 months to 11 May 2024. The 'Rank Change' column provides an indication of the change in demand within each location based on the same 6 month period last year.

Location Rank Change
on Same Period
Last Year
Matching
Contract
IT Job Ads
Median
Daily Rate
Past 6 Months
Median Daily Rate
% Change
on Same Period
Last Year
Live
Jobs
England +87 47 £413 -8.33% 34
London +84 33 £444 -1.39% 13
Work from Home +110 12 £350 -12.50% 20
UK excluding London +46 12 £400 +6.67% 21
North of England +35 8 £400 +6.67% 5
North West +19 8 £400 +40.35% 3
Midlands +28 3 £260 -25.71% 5
West Midlands +15 3 £260 -25.71% 1
South East +18 1 £500 +25.00% 3

Mimecast
Co-occurring Skills and Capabilities by Category

The follow tables expand on the table above by listing co-occurrences grouped by category. The same employment type, locality and period is covered with up to 20 co-occurrences shown in each of the following categories:

Application Platforms
1 28 (57.14%) Microsoft Exchange
2 8 (16.33%) SharePoint
3 3 (6.12%) IIS
4 2 (4.08%) Exchange Server 2010
4 2 (4.08%) Exchange Server 2013
Applications
1 2 (4.08%) Microsoft Office
Cloud Services
1 40 (81.63%) Microsoft 365
2 36 (73.47%) Azure
3 14 (28.57%) Entra ID
4 12 (24.49%) AWS
5 11 (22.45%) IaaS
5 11 (22.45%) Power Platform
6 7 (14.29%) PaaS
7 6 (12.24%) GCP
8 2 (4.08%) Azure ExpressRoute
8 2 (4.08%) Azure Sentinel
8 2 (4.08%) Cloud Computing
8 2 (4.08%) Nutanix
8 2 (4.08%) Rubrik
9 1 (2.04%) Azure AKS
9 1 (2.04%) Google Workspace
9 1 (2.04%) Microsoft Purview
9 1 (2.04%) OneDrive
Communications & Networking
1 18 (36.73%) Firewall
2 11 (22.45%) DNS
3 6 (12.24%) DHCP
3 6 (12.24%) VPN
4 5 (10.20%) DKIM
4 5 (10.20%) DMARC
4 5 (10.20%) LAN
4 5 (10.20%) MPLS
5 4 (8.16%) Network Security
5 4 (8.16%) TCP/IP
6 3 (6.12%) WAN
7 2 (4.08%) Extranet
7 2 (4.08%) Internet
7 2 (4.08%) NAS
7 2 (4.08%) SAN
7 2 (4.08%) Wi-Fi
7 2 (4.08%) Wireless
8 1 (2.04%) IPsec
8 1 (2.04%) IPv6
8 1 (2.04%) SSL
Database & Business Intelligence
1 5 (10.20%) Power BI
Development Applications
1 6 (12.24%) Hudson
General
1 9 (18.37%) Social Skills
2 7 (14.29%) Documentation Skills
3 6 (12.24%) Presentation Skills
4 5 (10.20%) Analytical Skills
4 5 (10.20%) Finance
5 4 (8.16%) French Language
6 3 (6.12%) Law
7 2 (4.08%) Advertising
8 1 (2.04%) Legal
Job Titles
1 9 (18.37%) Infrastructure Engineer
2 7 (14.29%) Analyst
3 6 (12.24%) Architect
4 5 (10.20%) Lead
4 5 (10.20%) Security Engineer
5 4 (8.16%) Integration Architect
5 4 (8.16%) Lead Infrastructure Engineer
5 4 (8.16%) Security Analyst
6 3 (6.12%) IT Support
6 3 (6.12%) Messaging Engineer
6 3 (6.12%) Security Manager
6 3 (6.12%) Senior
7 2 (4.08%) Cybersecurity Manager
7 2 (4.08%) Infrastructure Security Engineer
7 2 (4.08%) Integration Engineer
7 2 (4.08%) IT Engineer
7 2 (4.08%) Messaging Consultant
7 2 (4.08%) Microsoft 365 Specialist
7 2 (4.08%) Senior Messaging Engineer
7 2 (4.08%) Support Officer
Libraries, Frameworks & Software Standards
1 3 (6.12%) LDAP
2 2 (4.08%) Software Packaging
Miscellaneous
1 8 (16.33%) Data Centre
1 8 (16.33%) PKI
2 5 (10.20%) Cyber Threat
3 3 (6.12%) Management Information System
3 3 (6.12%) Self-Motivation
4 2 (4.08%) Data Protection Act
4 2 (4.08%) Fat Client
4 2 (4.08%) Security Posture
4 2 (4.08%) Thin Client
4 2 (4.08%) Virtual Team
5 1 (2.04%) Blackberry
5 1 (2.04%) Cyberattack
5 1 (2.04%) Enterprise Software
5 1 (2.04%) Mobile App
5 1 (2.04%) Operational Technology
Operating Systems
1 24 (48.98%) Windows
2 8 (16.33%) Linux
3 7 (14.29%) Windows Server
4 5 (10.20%) Mac OS
5 4 (8.16%) Apple iOS
5 4 (8.16%) Windows 10
6 2 (4.08%) Unix
7 1 (2.04%) Windows Server 2012
7 1 (2.04%) Windows Server 2016
7 1 (2.04%) Windows Server 2019
Processes & Methodologies
1 19 (38.78%) Infrastructure Engineering
2 15 (30.61%) Migration
3 11 (22.45%) ITIL
4 10 (20.41%) Cybersecurity
5 9 (18.37%) Change Management
5 9 (18.37%) Data Loss Prevention
5 9 (18.37%) Information Security
5 9 (18.37%) Project Delivery
6 7 (14.29%) Problem-Solving
7 6 (12.24%) B2B
7 6 (12.24%) Data Migration
7 6 (12.24%) Identity Management
8 5 (10.20%) Cloud Security
8 5 (10.20%) Problem Management
8 5 (10.20%) Time Management
8 5 (10.20%) TOGAF
9 4 (8.16%) Customer Service
9 4 (8.16%) IT Strategy
9 4 (8.16%) Kalman Filter
9 4 (8.16%) Mobile Device Management
Programming Languages
1 16 (32.65%) PowerShell
2 3 (6.12%) Python
3 1 (2.04%) Bash
3 1 (2.04%) C#
Qualifications
1 6 (12.24%) Azure Certification
2 5 (10.20%) Degree
2 5 (10.20%) TOGAF Certification
3 3 (6.12%) Microsoft Certification
4 2 (4.08%) MCP
4 2 (4.08%) MCSE
4 2 (4.08%) MOS
4 2 (4.08%) SC Cleared
4 2 (4.08%) Security Cleared
5 1 (2.04%) CISSP
5 1 (2.04%) ITIL Certification
5 1 (2.04%) MCSA
Quality Assurance & Compliance
1 3 (6.12%) QA
1 3 (6.12%) SLA
2 2 (4.08%) ISO/IEC 27001
3 1 (2.04%) Cyber Essentials
3 1 (2.04%) Cyber Essentials PLUS
3 1 (2.04%) GDPR
3 1 (2.04%) NIST
System Software
1 26 (53.06%) Active Directory
2 10 (20.41%) VMware Infrastructure
3 3 (6.12%) Hyper-V
4 2 (4.08%) Active Directory Lightweight Directory Services
4 2 (4.08%) BitLocker
4 2 (4.08%) Microsoft App-V
4 2 (4.08%) VMware ESXi
4 2 (4.08%) XenApp
5 1 (2.04%) Terminal Server
Systems Management
1 21 (42.86%) Microsoft Intune
2 8 (16.33%) SCCM
3 5 (10.20%) Active Directory Federation Services
4 3 (6.12%) FortiGate
5 2 (4.08%) Kubernetes
5 2 (4.08%) McAfee ePO
5 2 (4.08%) Nessus
5 2 (4.08%) NetBackup
5 2 (4.08%) SCOM
5 2 (4.08%) SCVMM
5 2 (4.08%) Terraform
5 2 (4.08%) VxRail
6 1 (2.04%) Jamf Pro
Vendors
1 27 (55.10%) Microsoft
2 13 (26.53%) Citrix
3 11 (22.45%) Sophos
3 11 (22.45%) VMware
4 6 (12.24%) Proofpoint
5 5 (10.20%) CrowdStrike
5 5 (10.20%) SolarWinds
6 4 (8.16%) Darktrace
6 4 (8.16%) HP
6 4 (8.16%) Okta
7 3 (6.12%) Cisco
8 2 (4.08%) Avaya
8 2 (4.08%) Commvault
8 2 (4.08%) Dell
8 2 (4.08%) EMC
8 2 (4.08%) Forcepoint
8 2 (4.08%) Juniper
8 2 (4.08%) McAfee
8 2 (4.08%) Mitel
8 2 (4.08%) Wyse