Google Jobs in Birmingham

Google
West Midlands > Birmingham

The table below provides summary statistics for permanent job vacancies advertised in Birmingham requiring knowledge or experience of Google products and/or services. It includes a benchmarking guide to the annual salaries offered in vacancies that cited Google over the 6 months leading up to 14 May 2025, comparing them to the same period in the previous two years.

The figures below represent the IT labour market in general and are not representative of salaries within Google.

6 months to
14 May 2025
Same period 2024 Same period 2023
Rank 79 66 118
Rank change year-on-year -13 +52 +30
Permanent jobs citing Google 24 88 16
As % of all permanent jobs advertised in Birmingham 1.71% 3.19% 0.82%
As % of the Vendors category 3.68% 8.03% 1.78%
Number of salaries quoted 19 62 11
10th Percentile £41,000 £30,000 £37,500
25th Percentile £45,000 £32,750 £41,875
Median annual salary (50th Percentile) £62,500 £55,000 £56,500
Median % change year-on-year +13.64% -2.65% +2.73%
75th Percentile £74,014 £70,625 £83,750
90th Percentile £74,711 £83,258 £97,500
West Midlands median annual salary £39,500 £42,500 £50,000
% change year-on-year -7.06% -15.00% -4.76%

All Vendors
Birmingham

Google falls under the Vendor Products and Services category. For comparison with the information above, the following table provides summary statistics for all permanent job vacancies requiring knowledge or experience of all vendor products and services in Birmingham.

Permanent vacancies with a requirement for knowledge or experience of vendor products and services 653 1,096 901
As % of all permanent jobs advertised in Birmingham 46.51% 39.71% 46.21%
Number of salaries quoted 432 890 670
10th Percentile £32,500 £26,700 £30,450
25th Percentile £42,500 £36,250 £41,250
Median annual salary (50th Percentile) £55,000 £52,500 £55,000
Median % change year-on-year +4.76% -4.55% +4.76%
75th Percentile £67,500 £67,500 £71,250
90th Percentile £78,750 £82,626 £83,750
West Midlands median annual salary £51,500 £47,500 £50,024
% change year-on-year +8.42% -5.05% +7.58%

Google
Job Vacancy Trend in Birmingham

Job postings citing Google as a proportion of all IT jobs advertised in Birmingham.
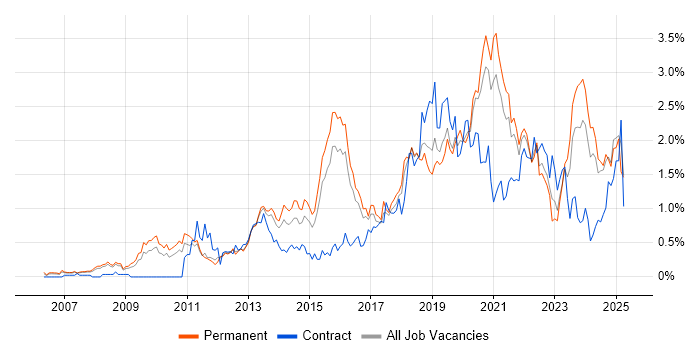
Job vacancy trend for Google in Birmingham

Google
Salary Trend in Birmingham

3-month moving average salary quoted in jobs citing Google in Birmingham.

Salary trend for Google in Birmingham

Google
Salary Histogram in Birmingham

Salary distribution for jobs citing Google in Birmingham over the 6 months to 14 May 2025.

Salary histogram for Google in Birmingham

Google
Co-occurring Skills and Capabilities in Birmingham by Category

The follow tables expand on the table above by listing co-occurrences grouped by category. The same employment type, locality and period is covered with up to 20 co-occurrences shown in each of the following categories:

Application Platforms
1 5 (20.83%) CMS
2 3 (12.50%) WordPress
3 2 (8.33%) Headless CMS
Applications
1 3 (12.50%) Microsoft Excel
1 3 (12.50%) Microsoft Office
1 3 (12.50%) Microsoft PowerPoint
Cloud Services
1 14 (58.33%) Azure
2 10 (41.67%) GCP
3 8 (33.33%) AWS
4 7 (29.17%) Serverless
5 6 (25.00%) Google Analytics
5 6 (25.00%) Power Platform
6 5 (20.83%) Google Ads
7 2 (8.33%) Contentful
7 2 (8.33%) Figma
7 2 (8.33%) Google Data Studio
8 1 (4.17%) Amazon ECR
8 1 (4.17%) Amazon ECS
8 1 (4.17%) Amazon OpenSearch
8 1 (4.17%) AWS CodeBuild
8 1 (4.17%) Azure Monitor
8 1 (4.17%) dbt
8 1 (4.17%) GitHub Copilot
8 1 (4.17%) Google Sheets
8 1 (4.17%) Pulumi
8 1 (4.17%) Sentry
Communications & Networking
1 2 (8.33%) SMS
2 1 (4.17%) Network Security
2 1 (4.17%) TCP/IP
2 1 (4.17%) Wi-Fi
Database & Business Intelligence
1 6 (25.00%) Power BI
2 3 (12.50%) PostgreSQL
2 3 (12.50%) Power Query
3 2 (8.33%) MongoDB
3 2 (8.33%) NoSQL
3 2 (8.33%) Tableau
4 1 (4.17%) Amazon RDS
4 1 (4.17%) Elasticsearch
4 1 (4.17%) Redis
4 1 (4.17%) SQL Server
Development Applications
1 2 (8.33%) Storybook
2 1 (4.17%) Octopus Deploy
General
1 7 (29.17%) Analytical Skills
2 5 (20.83%) Influencing Skills
2 5 (20.83%) Marketing
3 4 (16.67%) Finance
3 4 (16.67%) Retail
3 4 (16.67%) Social Skills
4 2 (8.33%) Advertising
4 2 (8.33%) Public Sector
5 1 (4.17%) Aerospace
5 1 (4.17%) Inclusion and Diversity
Job Titles
1 6 (25.00%) Developer
2 5 (20.83%) Architect
2 5 (20.83%) Cloud Architect
3 3 (12.50%) Business Intelligence Developer
3 3 (12.50%) Embedded Developer
3 3 (12.50%) Head of Communications
3 3 (12.50%) Head of Design
3 3 (12.50%) Head of Digital
3 3 (12.50%) Power BI Developer
3 3 (12.50%) Senior
4 2 (8.33%) Full-Stack Developer
4 2 (8.33%) Full-Stack JavaScript Developer
4 2 (8.33%) JavaScript Developer
5 1 (4.17%) Business Intelligence Lead
5 1 (4.17%) Cloud Engineer
5 1 (4.17%) IT Engineer
5 1 (4.17%) Senior Cloud Engineer
5 1 (4.17%) Senior IT Engineer
5 1 (4.17%) Site Engineer
5 1 (4.17%) Technology Manager
Libraries, Frameworks & Software Standards
1 4 (16.67%) .NET
2 3 (12.50%) AngularJS
2 3 (12.50%) CSS
2 3 (12.50%) HTML
3 2 (8.33%) CSS3
3 2 (8.33%) Express.js
3 2 (8.33%) GraphQL
3 2 (8.33%) hapi
3 2 (8.33%) HTML5
3 2 (8.33%) Material-UI
3 2 (8.33%) MEAN Stack
3 2 (8.33%) MERN Stack
3 2 (8.33%) NestJS
3 2 (8.33%) Node.js
3 2 (8.33%) React
3 2 (8.33%) React Native
3 2 (8.33%) REST
3 2 (8.33%) Vue
4 1 (4.17%) .NET Framework
4 1 (4.17%) Django
Miscellaneous
1 5 (20.83%) Social Media
2 3 (12.50%) Cloud Native
3 2 (8.33%) Analytical Mindset
3 2 (8.33%) Mobile App
4 1 (4.17%) Distributed Systems
4 1 (4.17%) Greenfield Project
Operating Systems
1 1 (4.17%) Linux
1 1 (4.17%) Unix
Processes & Methodologies
1 9 (37.50%) Analytics
2 7 (29.17%) Software Engineering
3 6 (25.00%) Business Intelligence
3 6 (25.00%) Problem-Solving
4 5 (20.83%) Agile
4 5 (20.83%) Data Development
4 5 (20.83%) Digital Identity
4 5 (20.83%) Pay per click
5 4 (16.67%) A/B Testing
5 4 (16.67%) CI/CD
5 4 (16.67%) Digital Marketing
5 4 (16.67%) Marketing Strategy
5 4 (16.67%) Personalization
6 3 (12.50%) Artificial Intelligence
6 3 (12.50%) Data Analytics
6 3 (12.50%) DevOps
6 3 (12.50%) Social Media Analytics
6 3 (12.50%) Strategic Thinking
6 3 (12.50%) User Experience
6 3 (12.50%) Visualisation
Programming Languages
1 4 (16.67%) Data Analysis Expressions
2 3 (12.50%) C#
2 3 (12.50%) JavaScript
3 2 (8.33%) Python
3 2 (8.33%) SQL
3 2 (8.33%) TypeScript
Qualifications
1 8 (33.33%) SC Cleared
1 8 (33.33%) Security Cleared
Quality Assurance & Compliance
1 3 (12.50%) Accessibility
System Software
1 1 (4.17%) Docker
Systems Management
1 2 (8.33%) Terraform
2 1 (4.17%) AWS Copilot
2 1 (4.17%) Grafana
2 1 (4.17%) Kubernetes
2 1 (4.17%) Prometheus
Vendors
1 5 (20.83%) Facebook
1 5 (20.83%) Instagram
2 4 (16.67%) Microsoft
3 3 (12.50%) Databricks
3 3 (12.50%) Twitter
3 3 (12.50%) YouTube
4 2 (8.33%) Hotjar
4 2 (8.33%) Optimizely
5 1 (4.17%) ConnectWise