Adobe Jobs in the City of London

Adobe
Central London > City of London

The table below provides summary statistics for permanent job vacancies advertised in the City of London with a requirement for knowledge and experience of Adobe products and/or services. Included is a benchmarking guide to the salaries offered in vacancies that have cited Adobe over the 6 months to 25 April 2024 with a comparison to the same period in the previous 2 years.

The figures below represent the IT labour market in general and are not representative of salaries within Adobe Systems, Inc.

6 months to
25 Apr 2024
Same period 2023 Same period 2022
Rank 151 165 112
Rank change year-on-year +14 -53 +84
Permanent jobs citing Adobe 27 69 191
As % of all permanent jobs advertised in the City of London 0.80% 1.44% 2.72%
As % of the Vendors category 2.09% 3.64% 7.72%
Number of salaries quoted 16 54 69
10th Percentile £33,750 £29,450 £39,600
25th Percentile £35,938 £42,500 £42,500
Median annual salary (50th Percentile) £50,000 £60,000 £57,500
Median % change year-on-year -16.67% +4.35% -10.51%
75th Percentile £52,500 £85,000 £105,000
90th Percentile £61,250 £110,000 £110,000
Central London median annual salary £50,000 £56,250 £57,500
% change year-on-year -11.11% -2.17% -11.54%

All Vendors
City of London

Adobe is in the Vendor Products and Services category. The following table is for comparison with the above and provides summary statistics for all permanent job vacancies with a requirement for knowledge or experience of vendor products and services advertised in the City of London.

Permanent vacancies with a requirement for knowledge or experience of vendor products and services 1,291 1,895 2,475
As % of all permanent jobs advertised in the City of London 38.42% 39.56% 35.31%
Number of salaries quoted 992 1,503 1,841
10th Percentile £37,000 £37,500 £39,250
25th Percentile £47,500 £50,000 £51,250
Median annual salary (50th Percentile) £70,000 £69,000 £67,500
Median % change year-on-year +1.45% +2.22% -3.57%
75th Percentile £87,500 £90,000 £86,250
90th Percentile £105,000 £106,250 £101,250
Central London median annual salary £67,500 £67,500 £65,000
% change year-on-year - +3.85% -3.70%

Adobe
Job Vacancy Trend in the City of London

Job postings citing Adobe as a proportion of all IT jobs advertised in the City of London.
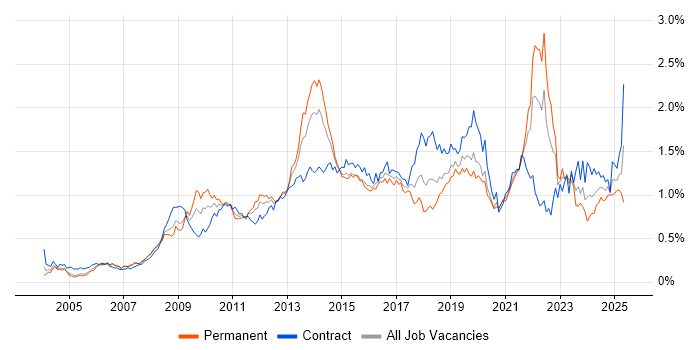
Job vacancy trend for Adobe in the City of London

Adobe
Salary Trend in the City of London

3-month moving average salary quoted in jobs citing Adobe in the City of London.

Salary trend for Adobe in the City of London

Adobe
Salary Histogram in the City of London

Salary distribution for jobs citing Adobe in the City of London over the 6 months to 25 April 2024.

Salary histogram for Adobe in the City of London

Adobe
Co-occurring Skills and Capabilities in the City of London by Category

The follow tables expand on the table above by listing co-occurrences grouped by category. The same employment type, locality and period is covered with up to 20 co-occurrences shown in each of the following categories:

Application Platforms
1 10 (37.04%) CMS
2 3 (11.11%) Microsoft Exchange
3 1 (3.70%) Adobe Experience Manager
Applications
1 8 (29.63%) Microsoft Office
1 8 (29.63%) Photoshop
2 6 (22.22%) Adobe Creative Suite
3 4 (14.81%) Adobe After Effects
3 4 (14.81%) Blender
4 1 (3.70%) Sketch
Business Applications
1 8 (29.63%) SDL Web 8
2 2 (7.41%) Carpe Diem
2 2 (7.41%) Magento
Cloud Services
1 9 (33.33%) Adobe Creative Cloud
2 8 (29.63%) NuGet
3 6 (22.22%) Azure
4 4 (14.81%) Google Workspace
4 4 (14.81%) Microsoft 365
5 3 (11.11%) AWS
5 3 (11.11%) GCP
5 3 (11.11%) Google Drive
5 3 (11.11%) WhatsApp
6 2 (7.41%) Azure Data Factory
6 2 (7.41%) Azure Synapse Analytics
6 2 (7.41%) Google Ads
6 2 (7.41%) Google Analytics
6 2 (7.41%) Power Platform
6 2 (7.41%) Serverless
7 1 (3.70%) Entra ID
7 1 (3.70%) Figma
7 1 (3.70%) Mimecast
7 1 (3.70%) Salesforce Commerce Cloud
7 1 (3.70%) Snowflake
Communications & Networking
1 3 (11.11%) LAN
2 2 (7.41%) SNA
Database & Business Intelligence
1 8 (29.63%) SQL Server
2 2 (7.41%) Azure SQL Database
2 2 (7.41%) Data Lake
2 2 (7.41%) Power BI
Development Applications
1 9 (33.33%) JIRA
2 8 (29.63%) Git
2 8 (29.63%) git-flow
2 8 (29.63%) Moq
2 8 (29.63%) NUnit
2 8 (29.63%) Octopus Deploy
2 8 (29.63%) Sourcetree
2 8 (29.63%) SpecFlow
2 8 (29.63%) TeamCity
2 8 (29.63%) Visual Studio
General
1 12 (44.44%) Marketing
2 9 (33.33%) Social Skills
3 7 (25.93%) Games
4 4 (14.81%) Banking
4 4 (14.81%) Finance
5 3 (11.11%) Advertising
5 3 (11.11%) Analytical Skills
5 3 (11.11%) Legal
6 2 (7.41%) Law
6 2 (7.41%) Music Industry
6 2 (7.41%) Retail
7 1 (3.70%) Corporate Banking
7 1 (3.70%) Investment Banking
7 1 (3.70%) Retail Banking
Job Titles
1 10 (37.04%) Developer
2 9 (33.33%) Senior
2 9 (33.33%) Senior Developer
3 8 (29.63%) C# Developer
3 8 (29.63%) Full Stack Developer
3 8 (29.63%) Full-Stack C# Developer
3 8 (29.63%) Senior C# Developer
3 8 (29.63%) Senior Full Stack Developer
4 4 (14.81%) Animator
5 3 (11.11%) Analyst
5 3 (11.11%) Architect
5 3 (11.11%) IT Engineer
5 3 (11.11%) IT Support
5 3 (11.11%) IT Support Engineer
5 3 (11.11%) Service Analyst
5 3 (11.11%) Service Desk Analyst
5 3 (11.11%) Support Engineer
6 2 (7.41%) Azure Architect
6 2 (7.41%) Solutions Architect
7 1 (3.70%) Web Developer
Libraries, Frameworks & Software Standards
1 10 (37.04%) CSS
1 10 (37.04%) HTML
2 9 (33.33%) React
3 8 (29.63%) .NET
3 8 (29.63%) .NET Framework
3 8 (29.63%) ASP.NET
3 8 (29.63%) ASP.NET MVC
3 8 (29.63%) ASP.NET MVC 5
3 8 (29.63%) Autofac
3 8 (29.63%) Code First Entity Framework
3 8 (29.63%) Entity Framework
3 8 (29.63%) jQuery
3 8 (29.63%) Ninject
3 8 (29.63%) RESTful
3 8 (29.63%) Semantic HTML
3 8 (29.63%) SOAP
3 8 (29.63%) Web Services
3 8 (29.63%) XML
4 4 (14.81%) Unity (Game Engine)
5 1 (3.70%) Middleware
Miscellaneous
1 8 (29.63%) Greenfield Project
1 8 (29.63%) Legacy Code
2 5 (18.52%) Product Ownership
3 4 (14.81%) Animation
3 4 (14.81%) Mobile Games
3 4 (14.81%) Online Gambling
3 4 (14.81%) Team-Oriented Environment
3 4 (14.81%) Video Conferencing
4 2 (7.41%) Digital Media
4 2 (7.41%) Marketing Technology
4 2 (7.41%) Public Cloud
4 2 (7.41%) Social Media
5 1 (3.70%) Mobile App
Operating Systems
1 8 (29.63%) Windows
2 5 (18.52%) Windows Server
3 3 (11.11%) Windows 10
4 2 (7.41%) Android
4 2 (7.41%) Apple iOS
5 1 (3.70%) Mac OS
Processes & Methodologies
1 14 (51.85%) Problem-Solving
2 12 (44.44%) Mentoring
3 11 (40.74%) Agile
4 9 (33.33%) Responsive Web Design
5 8 (29.63%) API Development
5 8 (29.63%) Architectural Design
5 8 (29.63%) Architectural Patterns
5 8 (29.63%) Computer Science
5 8 (29.63%) DevOps
5 8 (29.63%) E-Commerce
5 8 (29.63%) Full Stack Development
5 8 (29.63%) Inversion of Control
5 8 (29.63%) Issue Tracking
5 8 (29.63%) Line Management
5 8 (29.63%) MVC
5 8 (29.63%) OO
5 8 (29.63%) Performance Tuning
5 8 (29.63%) Scrum
5 8 (29.63%) SOLID
5 8 (29.63%) Unit Testing
Programming Languages
1 12 (44.44%) SQL
2 8 (29.63%) C#
2 8 (29.63%) JavaScript
2 8 (29.63%) T-SQL
2 8 (29.63%) XPath
3 2 (7.41%) R
Qualifications
1 15 (55.56%) Degree
2 3 (11.11%) ITIL Certification
3 2 (7.41%) Azure Certification
3 2 (7.41%) Microsoft Certification
Quality Assurance & Compliance
1 2 (7.41%) Accessibility
1 2 (7.41%) ITGC
1 2 (7.41%) Sarbanes-Oxley
System Software
1 4 (14.81%) Active Directory
Systems Management
1 1 (3.70%) Jamf Pro
1 1 (3.70%) Microsoft Intune
1 1 (3.70%) SCCM
Vendors
1 8 (29.63%) Cognizant
2 7 (25.93%) Google
2 7 (25.93%) Microsoft
3 2 (7.41%) Apple
3 2 (7.41%) Citrix
3 2 (7.41%) HP
3 2 (7.41%) iManage
3 2 (7.41%) Kofax
3 2 (7.41%) Salesforce
4 1 (3.70%) Cisco
4 1 (3.70%) Databricks