Analyst Jobs in the East of England

Analyst
England > East of England

The median Analyst salary in the East of England is £47,500 per year, according to job vacancies posted during the 6 months leading to 18 May 2025.

The table below provides salary benchmarking and summary statistics, comparing them to the same period in the previous two years.

6 months to
18 May 2025
Same period 2024 Same period 2023
Rank 22 10 18
Rank change year-on-year -12 +8 -3
Permanent jobs requiring an Analyst 327 656 585
As % of all permanent jobs advertised in the East of England 9.78% 10.63% 11.27%
As % of the Job Titles category 10.37% 11.32% 13.41%
Number of salaries quoted 207 420 303
10th Percentile £25,750 £24,500 £23,000
25th Percentile £28,875 £27,000 £27,000
Median annual salary (50th Percentile) £47,500 £38,000 £39,500
Median % change year-on-year +25.00% -3.80% +0.55%
75th Percentile £55,625 £51,188 £53,750
90th Percentile £67,500 £57,000 £66,250
England median annual salary £47,500 £45,000 £47,500
% change year-on-year +5.56% -5.26% +4.97%

All Permanent IT Job Vacancies
East of England

For comparison with the information above, the following table provides summary statistics for all permanent IT job vacancies in the East of England. Most job vacancies include a discernible job title that can be normalized. As such, the figures in the second row provide an indication of the number of permanent jobs in our overall sample.

Permanent vacancies in the East of England with a recognized job title 3,153 5,797 4,362
% of permanent jobs with a recognized job title 94.34% 93.92% 84.05%
Number of salaries quoted 1,574 4,426 2,197
10th Percentile £27,500 £25,809 £26,250
25th Percentile £35,000 £31,250 £36,356
Median annual salary (50th Percentile) £50,000 £47,500 £55,000
Median % change year-on-year +5.26% -13.64% +10.00%
75th Percentile £66,100 £63,750 £67,500
90th Percentile £75,000 £75,000 £80,500
England median annual salary £56,500 £53,000 £60,800
% change year-on-year +6.60% -12.83% +1.33%

Analyst
Job Vacancy Trend in the East of England

Job postings that featured Analyst in the job title as a proportion of all IT jobs advertised in the East of England.
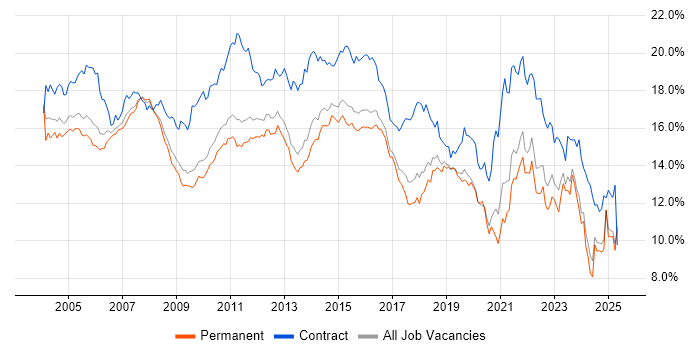
Job vacancy trend for Analyst in the East of England

Analyst
Salary Trend in the East of England

3-month moving average salary quoted in jobs citing Analyst in the East of England.

Salary trend for Analyst in the East of England

Analyst
Salary Histogram in the East of England

Salary distribution for jobs citing Analyst in the East of England over the 6 months to 18 May 2025.

Salary histogram for Analyst in the East of England

Analyst
Job Locations in the East of England

The table below looks at the demand and provides a guide to the median salaries quoted in IT jobs citing Analyst within the East of England region over the 6 months to 18 May 2025. The 'Rank Change' column provides an indication of the change in demand within each location based on the same 6 month period last year.

Location Rank Change
on Same Period
Last Year
Matching
Permanent
IT Job Ads
Median Salary
Past 6 Months
Median Salary
% Change
on Same Period
Last Year
Live
Jobs
Hertfordshire +4 138 £45,921 +14.80% 93
Suffolk -20 57 £32,500 -24.42% 9
Essex -5 48 £47,500 +18.75% 30
Bedfordshire -16 43 £47,500 -4.04% 24
Cambridgeshire -6 33 £51,422 +53.42% 43
Norfolk -42 6 £37,500 +22.95% 10
East Anglia - 2 £53,000 - 49
Analyst
England

Analyst Skill Set
Top 30 Co-occurring Skills and Capabilities in the East of England

For the 6 months to 18 May 2025, Analyst job roles required the following skills and capabilities in order of popularity. The figures indicate the absolute number co-occurrences and as a proportion of all permanent job ads across the East of England region featuring Analyst in the job title.

1 203 (62.08%) Social Skills
2 169 (51.68%) Analytical Skills
3 141 (43.12%) Problem-Solving
4 84 (25.69%) Stakeholder Engagement
5 83 (25.38%) Microsoft
5 83 (25.38%) Business Analysis
6 78 (23.85%) Degree
6 78 (23.85%) CBAP
7 73 (22.32%) Continuous Improvement
7 73 (22.32%) SQL
8 66 (20.18%) Business Case
9 65 (19.88%) Microsoft 365
10 64 (19.57%) Collaborative Working
11 63 (19.27%) Workshop Facilitation
12 62 (18.96%) Change Management
13 61 (18.65%) Use Case
13 61 (18.65%) MoSCoW
13 61 (18.65%) Influencing Skills
13 61 (18.65%) Strategic Thinking
14 59 (18.04%) Finance
15 54 (16.51%) Master's Degree
16 53 (16.21%) Azure
17 48 (14.68%) Customer Service
18 45 (13.76%) Active Directory
19 41 (12.54%) Decision-Making
20 39 (11.93%) Inclusion and Diversity
20 39 (11.93%) Risk Management
21 38 (11.62%) Banking
22 36 (11.01%) Asset Management
22 36 (11.01%) Microsoft PowerPoint

Analyst Skill Set
Co-occurring Skills and Capabilities in the East of England by Category

The follow tables expand on the table above by listing co-occurrences grouped by category. The same employment type, locality and period is covered with up to 20 co-occurrences shown in each of the following categories:

Application Platforms
1 17 (5.20%) SharePoint
2 15 (4.59%) Microsoft Exchange
3 2 (0.61%) Alfresco
3 2 (0.61%) Documentum
4 1 (0.31%) Confluence
4 1 (0.31%) Exchange Server 2013
4 1 (0.31%) Jupyter
4 1 (0.31%) SAS
4 1 (0.31%) Tomcat
Applications
1 36 (11.01%) Microsoft PowerPoint
2 22 (6.73%) Microsoft Excel
3 15 (4.59%) Microsoft Office
4 6 (1.83%) Chatbot
5 2 (0.61%) MS Visio
Business Applications
1 8 (2.45%) Infor M3
2 1 (0.31%) Dynamics AX
2 1 (0.31%) Dynamics CRM
2 1 (0.31%) Dynamics GP
2 1 (0.31%) Dynamics NAV
2 1 (0.31%) iTrent
2 1 (0.31%) SAP S/4HANA
2 1 (0.31%) SystmOne
Cloud Services
1 65 (19.88%) Microsoft 365
2 53 (16.21%) Azure
3 27 (8.26%) Power Platform
4 22 (6.73%) Entra ID
5 20 (6.12%) SaaS
6 8 (2.45%) AWS
7 6 (1.83%) Azure Sentinel
7 6 (1.83%) Cloud Computing
8 5 (1.53%) OneDrive
9 4 (1.22%) Power Automate
10 2 (0.61%) Mimecast
11 1 (0.31%) Cloudflare
11 1 (0.31%) Figma
11 1 (0.31%) GCP
11 1 (0.31%) PowerApps
11 1 (0.31%) Rubrik
11 1 (0.31%) SuccessFactors
Communications & Networking
1 23 (7.03%) Firewall
2 13 (3.98%) TCP/IP
3 12 (3.67%) DNS
3 12 (3.67%) FTP
4 11 (3.36%) DHCP
5 9 (2.75%) Network Security
6 8 (2.45%) WAN
6 8 (2.45%) Wi-Fi
7 7 (2.14%) VLAN
7 7 (2.14%) VPN
8 5 (1.53%) NGFW
9 4 (1.22%) LAN
10 3 (0.92%) HTTP
10 3 (0.92%) Internet
11 2 (0.61%) Intrusion Detection
11 2 (0.61%) SMTP
11 2 (0.61%) SSL
12 1 (0.31%) Intranet
12 1 (0.31%) SAN
12 1 (0.31%) VoIP
Database & Business Intelligence
1 27 (8.26%) Power BI
2 17 (5.20%) SQL Server
3 11 (3.36%) MySQL
4 7 (2.14%) Data Lake
4 7 (2.14%) Data Warehouse
5 4 (1.22%) BusinessObjects
6 3 (0.92%) Power Query
6 3 (0.92%) Tableau
7 2 (0.61%) Data Mining
7 2 (0.61%) Relational Database
8 1 (0.31%) Amazon QuickSight
8 1 (0.31%) Crystal Reports
8 1 (0.31%) Electronic Patient Records
8 1 (0.31%) GIS
8 1 (0.31%) NoSQL
Development Applications
1 8 (2.45%) JIRA
2 1 (0.31%) Cypress.io
2 1 (0.31%) Log4j
General
1 203 (62.08%) Social Skills
2 169 (51.68%) Analytical Skills
3 61 (18.65%) Influencing Skills
4 59 (18.04%) Finance
5 39 (11.93%) Inclusion and Diversity
6 38 (11.62%) Banking
7 35 (10.70%) Financial Institution
8 34 (10.40%) French Language
8 34 (10.40%) German Language
9 18 (5.50%) Manufacturing
10 9 (2.75%) Marketing
11 8 (2.45%) Law
12 6 (1.83%) Legal
12 6 (1.83%) Organisational Skills
12 6 (1.83%) Retail
13 5 (1.53%) Advertising
13 5 (1.53%) Pharmaceutical
14 4 (1.22%) Billing
15 2 (0.61%) Aerospace
15 2 (0.61%) Aviation
Libraries, Frameworks & Software Standards
1 21 (6.42%) HTML
2 11 (3.36%) JSON
2 11 (3.36%) REST
2 11 (3.36%) SOAP
2 11 (3.36%) XML
3 10 (3.06%) Web Services
4 2 (0.61%) LDAP
5 1 (0.31%) .NET
5 1 (0.31%) Apache Camel
5 1 (0.31%) CSS
5 1 (0.31%) Elastic Stack
5 1 (0.31%) IDoc
5 1 (0.31%) OAuth
5 1 (0.31%) Oracle Fusion
5 1 (0.31%) Playwright
5 1 (0.31%) React Native
5 1 (0.31%) Spring
Miscellaneous
1 34 (10.40%) Credit Risk
1 34 (10.40%) Fixed Income
2 21 (6.42%) Analytical Mindset
3 14 (4.28%) Management Information System
4 9 (2.75%) Security Operations Centre
5 6 (1.83%) Cyber Threat
6 5 (1.53%) Biopharmaceutical
6 5 (1.53%) iPad
6 5 (1.53%) iPhone
6 5 (1.53%) Mobile App
6 5 (1.53%) Self-Motivation
7 4 (1.22%) Reinsurance
8 3 (0.92%) Client/Server
8 3 (0.92%) Driving Licence
8 3 (0.92%) Renewable Energy
8 3 (0.92%) Security Posture
9 2 (0.61%) Blackberry
9 2 (0.61%) CMDB
9 2 (0.61%) FMCG
9 2 (0.61%) Product Ownership
Operating Systems
1 36 (11.01%) Windows
2 17 (5.20%) Windows Server
3 7 (2.14%) Windows 10
4 6 (1.83%) Mac OS
5 5 (1.53%) Windows Server 2019
6 4 (1.22%) Linux
7 3 (0.92%) Apple iOS
8 2 (0.61%) Android
8 2 (0.61%) Windows Server 2016
Processes & Methodologies
1 141 (43.12%) Problem-Solving
2 84 (25.69%) Stakeholder Engagement
3 83 (25.38%) Business Analysis
4 73 (22.32%) Continuous Improvement
5 66 (20.18%) Business Case
6 64 (19.57%) Collaborative Working
7 63 (19.27%) Workshop Facilitation
8 62 (18.96%) Change Management
9 61 (18.65%) MoSCoW
9 61 (18.65%) Strategic Thinking
9 61 (18.65%) Use Case
10 48 (14.68%) Customer Service
11 41 (12.54%) Decision-Making
12 39 (11.93%) Risk Management
13 36 (11.01%) Asset Management
13 36 (11.01%) Business Strategy
14 35 (10.70%) Financial Modelling
14 35 (10.70%) Risk Assessment
15 34 (10.40%) Credit Risk Analysis
15 34 (10.40%) Portfolio Management
Programming Languages
1 73 (22.32%) SQL
2 14 (4.28%) Python
3 11 (3.36%) JavaScript
4 7 (2.14%) C#
5 6 (1.83%) C++
6 3 (0.92%) Data Analysis Expressions
6 3 (0.92%) PowerShell
7 1 (0.31%) Go
7 1 (0.31%) Java
7 1 (0.31%) Kusto Query Language
7 1 (0.31%) PHP
7 1 (0.31%) R
Qualifications
1 78 (23.85%) CBAP
1 78 (23.85%) Degree
2 54 (16.51%) Master's Degree
3 34 (10.40%) CFA
4 24 (7.34%) Microsoft Certification
5 18 (5.50%) Security Cleared
6 17 (5.20%) PMI Certification
6 17 (5.20%) PMP
7 13 (3.98%) A+ Certification
8 11 (3.36%) SC Cleared
9 9 (2.75%) DBS Check
10 7 (2.14%) DV Cleared
11 6 (1.83%) Azure Certification
12 4 (1.22%) CompTIA Security+
13 2 (0.61%) IIBA
14 1 (0.31%) CISA
14 1 (0.31%) CISSP
14 1 (0.31%) GCIA
14 1 (0.31%) ISEB
14 1 (0.31%) ITIL Certification
Quality Assurance & Compliance
1 16 (4.89%) SLA
2 6 (1.83%) GDPR
2 6 (1.83%) GxP
3 4 (1.22%) QA
4 3 (0.92%) NIST
5 2 (0.61%) Data Quality
5 2 (0.61%) Sarbanes-Oxley
6 1 (0.31%) ISO/IEC 27001
6 1 (0.31%) PMO
6 1 (0.31%) Solvency II
System Software
1 45 (13.76%) Active Directory
2 5 (1.53%) Firmware
2 5 (1.53%) Virtual Desktop
3 4 (1.22%) Hyper-V
4 1 (0.31%) VMware Infrastructure
Systems Management
1 11 (3.36%) Microsoft Intune
2 2 (0.61%) Graylog
2 2 (0.61%) QRadar
2 2 (0.61%) Single Sign-On
3 1 (0.31%) CSIRT
3 1 (0.31%) NetBackup
Vendors
1 83 (25.38%) Microsoft
2 34 (10.40%) Bloomberg
3 18 (5.50%) YouTube
4 8 (2.45%) Infor
4 8 (2.45%) ServiceNow
4 8 (2.45%) VMware
5 7 (2.14%) SAP
6 6 (1.83%) PayPal
7 5 (1.53%) Oracle
8 4 (1.22%) Duck Creek
8 4 (1.22%) Guidewire
9 3 (0.92%) Cisco
9 3 (0.92%) Splunk
10 2 (0.61%) Apple
10 2 (0.61%) Citrix
10 2 (0.61%) HP
10 2 (0.61%) NetApp
11 1 (0.31%) Commvault
11 1 (0.31%) Dell
11 1 (0.31%) JDA