Customer Service Jobs in the East of England

Customer Service
England > East of England

The table below provides summary statistics for permanent job vacancies advertised in the East of England requiring Customer Service skills. It includes a benchmarking guide to the annual salaries offered in vacancies that cited Customer Service over the 6 months leading up to 28 August 2025, comparing them to the same period in the previous two years.

6 months to
28 Aug 2025
Same period 2024 Same period 2023
Rank 8 17 26
Rank change year-on-year +9 +9 -14
DemandTrendPermanent jobs citing Customer Service 513 319 235
As % of all permanent jobs advertised in the East of England 13.72% 6.64% 7.88%
As % of the Processes & Methodologies category 15.58% 9.04% 8.37%
Number of salaries quoted 220 196 166
10th Percentile £25,500 £25,000 £21,125
25th Percentile £26,250 £30,873 £25,000
Median annual salary (50th Percentile) £30,000 £40,000 £29,000
Median % change year-on-year -25.00% +37.93% -27.50%
75th Percentile £38,750 £55,000 £49,375
90th Percentile £56,250 £65,000 £60,000
England median annual salary £29,000 £35,000 £36,000
% change year-on-year -17.14% -2.78% -8.45%

All Process and Methodology Skills
East of England

Customer Service falls under the Processes and Methodologies category. For comparison with the information above, the following table provides summary statistics for all permanent job vacancies requiring process or methodology skills in the East of England.

DemandTrendPermanent vacancies with a requirement for process or methodology skills 3,292 3,530 2,807
As % of all permanent jobs advertised in the East of England 88.07% 73.47% 94.13%
Number of salaries quoted 1,640 2,142 1,468
10th Percentile £26,500 £27,500 £25,500
25th Percentile £32,500 £37,125 £36,250
Median annual salary (50th Percentile) £45,000 £50,000 £55,000
Median % change year-on-year -10.00% -9.09% +4.76%
75th Percentile £62,500 £67,500 £67,500
90th Percentile £75,000 £83,058 £80,000
England median annual salary £55,000 £56,500 £62,009
% change year-on-year -2.65% -8.88% +3.35%

Customer Service
Job Vacancy Trend in the East of England

Job postings citing Customer Service as a proportion of all IT jobs advertised in the East of England.
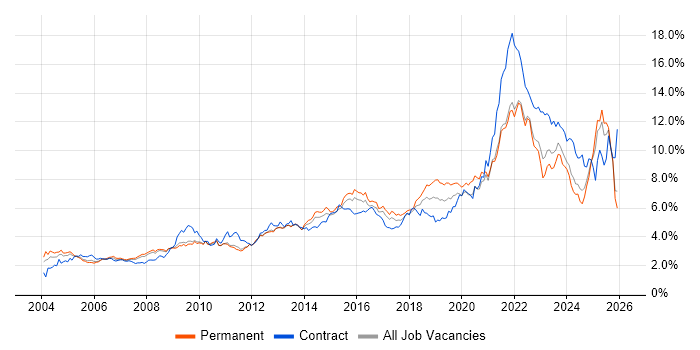
Job vacancy trend for Customer Service in the East of England

Customer Service
Salary Trend in the East of England

Salary distribution trend for jobs in the East of England citing Customer Service.

Salary distribution trend for jobs in the East of England citing Customer Service

Customer Service
Salary Histogram in the East of England

Salary distribution for jobs citing Customer Service in the East of England over the 6 months to 28 August 2025.

Salary histogram for Customer Service in the East of England

Customer Service
Job Locations in the East of England

The table below looks at the demand and provides a guide to the median salaries quoted in IT jobs citing Customer Service within the East of England region over the 6 months to 28 August 2025. The 'Rank Change' column provides an indication of the change in demand within each location based on the same 6 month period last year.

Location Rank Change
on Same Period
Last Year
Matching
DemandTrendPermanent
IT Job Ads
Median Salary
Past 6 Months
Median Salary
% Change
on Same Period
Last Year
Live
Jobs
Suffolk +3 226 £51,500 +106.00% 12
Cambridgeshire +25 109 £27,500 -21.43% 29
Essex +1 72 £30,000 -25.00% 30
Hertfordshire -6 72 £35,000 -22.22% 51
Norfolk +6 20 £26,000 -44.85% 11
Bedfordshire -4 14 £32,500 -4.11% 13
Customer Service
England

Customer Service
Co-occurring Skills and Capabilities in the East of England by Category

The follow tables expand on the table above by listing co-occurrences grouped by category. The same employment type, locality and period is covered with up to 20 co-occurrences shown in each of the following categories:

Application Platforms
1 13 (2.53%) Microsoft Exchange
2 11 (2.14%) SharePoint
3 9 (1.75%) IIS
3 9 (1.75%) Tomcat
4 6 (1.17%) Confluence
5 1 (0.19%) IBM Domino
Applications
1 148 (28.85%) Microsoft Office
2 111 (21.64%) Microsoft Excel
3 2 (0.39%) Trello
4 1 (0.19%) Microsoft PowerPoint
Business Applications
1 3 (0.58%) C-CURE
2 1 (0.19%) Dynamics CRM
2 1 (0.19%) Infor M3
Cloud Services
1 111 (21.64%) Azure
2 82 (15.98%) Microsoft 365
3 59 (11.50%) Power Platform
4 48 (9.36%) Entra ID
5 25 (4.87%) SaaS
6 10 (1.95%) Microsoft Copilot
6 10 (1.95%) Power Automate
7 7 (1.36%) AWS
8 6 (1.17%) Asana
8 6 (1.17%) Miro
9 3 (0.58%) IaaS
9 3 (0.58%) OneDrive
9 3 (0.58%) PaaS
10 2 (0.39%) Dynamics 365
10 2 (0.39%) GCP
10 2 (0.39%) Mimecast
10 2 (0.39%) Salesforce Service Cloud
11 1 (0.19%) Cloud Computing
11 1 (0.19%) Collibra
11 1 (0.19%) PowerApps
Communications & Networking
1 28 (5.46%) Firewall
2 21 (4.09%) LAN
3 18 (3.51%) DHCP
3 18 (3.51%) DNS
3 18 (3.51%) WAN
4 14 (2.73%) TCP/IP
5 13 (2.53%) VoIP
6 12 (2.34%) VPN
7 11 (2.14%) Broadband
7 11 (2.14%) SSL
8 9 (1.75%) DMARC
9 6 (1.17%) Wi-Fi
10 5 (0.97%) ADSL
10 5 (0.97%) ADSL2+
10 5 (0.97%) Ethernet
10 5 (0.97%) G.fast
10 5 (0.97%) PSTN
10 5 (0.97%) WLAN
11 2 (0.39%) HTTP
12 1 (0.19%) Intranet
Database & Business Intelligence
1 58 (11.31%) Power BI
2 9 (1.75%) PostgreSQL
2 9 (1.75%) SQL Server
3 8 (1.56%) Tableau
4 2 (0.39%) NoSQL
5 1 (0.19%) MS Access
Development Applications
1 17 (3.31%) JIRA
2 2 (0.39%) LabVIEW
3 1 (0.19%) ERwin
3 1 (0.19%) Git
General
1 210 (40.94%) Social Skills
2 83 (16.18%) Finance
3 56 (10.92%) Electronics
4 35 (6.82%) Marketing
5 28 (5.46%) Analytical Skills
6 24 (4.68%) Legal
7 23 (4.48%) Billing
8 22 (4.29%) Organisational Skills
9 17 (3.31%) Presentation Skills
10 12 (2.34%) Influencing Skills
10 12 (2.34%) Retail
11 9 (1.75%) Czech Language
11 9 (1.75%) Telecoms
12 7 (1.36%) Manufacturing
13 6 (1.17%) Public Sector
14 5 (0.97%) Aerospace
15 4 (0.78%) Aviation
15 4 (0.78%) Back Office
15 4 (0.78%) Documentation Skills
16 3 (0.58%) German Language
Job Titles
1 88 (17.15%) Analyst
2 86 (16.76%) Account Executive
3 77 (15.01%) Business Manager
4 70 (13.65%) Development Manager
5 69 (13.45%) Support Analyst
6 57 (11.11%) 1st Line Support
6 57 (11.11%) Business Development Manager
6 57 (11.11%) IT Support
7 30 (5.85%) Lead
8 26 (5.07%) 1st Line Support Analyst
9 24 (4.68%) Technical Support
10 23 (4.48%) Sales Manager
11 22 (4.29%) Administrator
11 22 (4.29%) Project Manager
12 21 (4.09%) Operations Manager
12 21 (4.09%) Operations Project Manager
12 21 (4.09%) Sales Operations Manager
12 21 (4.09%) Support Engineer
13 20 (3.90%) Junior
13 20 (3.90%) Support Technician
Libraries, Frameworks & Software Standards
1 11 (2.14%) JSON
1 11 (2.14%) REST
1 11 (2.14%) SOAP
1 11 (2.14%) XML
2 2 (0.39%) .NET
2 2 (0.39%) Elastic Stack
2 2 (0.39%) OAuth
Miscellaneous
1 59 (11.50%) Self-Motivation
2 31 (6.04%) Data Centre
3 16 (3.12%) Management Information System
4 15 (2.92%) Onboarding
5 13 (2.53%) Driving Licence
6 9 (1.75%) Enterprise Software
7 8 (1.56%) Product Ownership
8 6 (1.17%) Over-the-Top Content
8 6 (1.17%) Social Media
8 6 (1.17%) Video\Live Streaming
9 5 (0.97%) iSeries
10 4 (0.78%) CCTV
10 4 (0.78%) Data Protection Act
10 4 (0.78%) Freedom of Information Act
10 4 (0.78%) Team-Oriented Environment
11 3 (0.58%) Biopharmaceutical
11 3 (0.58%) iPad
11 3 (0.58%) iPhone
11 3 (0.58%) SCADA
12 1 (0.19%) Home Automation
Operating Systems
1 97 (18.91%) Windows
2 29 (5.65%) Windows Server
3 25 (4.87%) Mac OS
4 16 (3.12%) Windows Server 2019
5 14 (2.73%) Linux
6 9 (1.75%) Unix
7 7 (1.36%) Windows 10
8 5 (0.97%) Apple iOS
9 3 (0.58%) Android
10 1 (0.19%) Red Hat Enterprise Linux
10 1 (0.19%) SUSE
Processes & Methodologies
1 194 (37.82%) Business Enablement
2 178 (34.70%) Business Development
3 165 (32.16%) Technology Enablement
4 147 (28.65%) Problem-Solving
5 97 (18.91%) Customer Experience
6 87 (16.96%) Business Strategy
7 73 (14.23%) Sales Enablement
8 68 (13.26%) Stakeholder Management
9 67 (13.06%) Business Intelligence
10 66 (12.87%) Service Delivery
11 65 (12.67%) Time Management
12 54 (10.53%) Continuous Improvement
13 53 (10.33%) CRM
13 53 (10.33%) Process Improvement
14 49 (9.55%) Analytics
14 49 (9.55%) ITIL
15 44 (8.58%) Data Analysis
16 40 (7.80%) Data Analytics
17 39 (7.60%) Project Management
18 37 (7.21%) Performance Metrics
Programming Languages
1 18 (3.51%) SQL
2 13 (2.53%) JavaScript
3 12 (2.34%) PowerShell
4 9 (1.75%) Java
4 9 (1.75%) VBA
5 7 (1.36%) Python
6 2 (0.39%) C
6 2 (0.39%) C#
7 1 (0.19%) C++
7 1 (0.19%) R
Qualifications
1 104 (20.27%) Degree
2 68 (13.26%) DBS Check
3 44 (8.58%) Microsoft Certification
4 32 (6.24%) A+ Certification
5 11 (2.14%) Network+ Certification
6 8 (1.56%) CompTIA Security+
7 7 (1.36%) MCP
8 6 (1.17%) Security Cleared
9 5 (0.97%) ITIL Foundation Certificate
9 5 (0.97%) MCITP
9 5 (0.97%) SC Cleared
10 3 (0.58%) AWS Certification
10 3 (0.58%) AWS Certified Solutions Architect
10 3 (0.58%) ISSAP
11 2 (0.39%) AAT
11 2 (0.39%) ACCA
11 2 (0.39%) CIMA
11 2 (0.39%) Master's Degree
11 2 (0.39%) MCDST
11 2 (0.39%) NVQ Level 4
Quality Assurance & Compliance
1 25 (4.87%) SLA
2 10 (1.95%) GDPR
2 10 (1.95%) ISO/IEC 27001
3 3 (0.58%) Actionable Recommendations
4 1 (0.19%) Accessibility
4 1 (0.19%) Government Security Classifications
4 1 (0.19%) ISO 13485
4 1 (0.19%) ISO 9001
4 1 (0.19%) NIST
4 1 (0.19%) PMO
System Software
1 69 (13.45%) Active Directory
2 17 (3.31%) Virtual Desktop
3 5 (0.97%) Hyper-V
3 5 (0.97%) VMware Infrastructure
4 1 (0.19%) Docker
4 1 (0.19%) Embedded Firmware
4 1 (0.19%) Firmware
4 1 (0.19%) VMware ESXi
4 1 (0.19%) VMware NSX
Systems Management
1 42 (8.19%) Microsoft Intune
2 9 (1.75%) Single Sign-On
3 7 (1.36%) Jamf Pro
4 5 (0.97%) SmoothWall
5 2 (0.39%) Graylog
6 1 (0.19%) Ansible
6 1 (0.19%) Avamar
6 1 (0.19%) CSIRT
6 1 (0.19%) Progress Chef
6 1 (0.19%) Puppet
6 1 (0.19%) vCenter Server
6 1 (0.19%) VxRail
Vendors
1 166 (32.36%) Microsoft
2 163 (31.77%) YouTube
3 45 (8.77%) Oracle
4 13 (2.53%) Salesforce
4 13 (2.53%) Tenable
5 11 (2.14%) Fortinet
6 9 (1.75%) Cisco
7 7 (1.36%) Intel
7 7 (1.36%) Meraki
7 7 (1.36%) VMware
8 6 (1.17%) Aruba
8 6 (1.17%) HP
8 6 (1.17%) ServiceNow
9 5 (0.97%) BroadSoft
9 5 (0.97%) Polycom
9 5 (0.97%) Yealink
10 4 (0.78%) Verint
11 3 (0.58%) Apple
11 3 (0.58%) EMC
11 3 (0.58%) Mitel