Visualisation Jobs in Scotland

Visualization
UK > Scotland

The table below provides summary statistics for permanent job vacancies advertised in Scotland requiring Visualisation skills. It includes a benchmarking guide to the annual salaries offered in vacancies that cited Visualisation over the 6 months leading up to 26 July 2024, comparing them to the same period in the previous two years.

6 months to
26 Jul 2024
Same period 2023 Same period 2022
Rank 24 124 145
Rank change year-on-year +100 +21 -38
Permanent jobs citing Visualisation 646 88 110
As % of all permanent jobs advertised in Scotland 11.34% 2.32% 1.81%
As % of the Processes & Methodologies category 12.91% 2.42% 1.96%
Number of salaries quoted 43 51 60
10th Percentile £33,500 £28,750 £36,017
25th Percentile £50,625 £37,902 £43,750
Median annual salary (50th Percentile) £71,991 £55,043 £55,000
Median % change year-on-year +30.79% +0.08% +4.76%
75th Percentile £80,000 £73,644 £67,500
90th Percentile - £80,000 £80,125
UK median annual salary £60,000 £60,000 £60,000
% change year-on-year - - +9.09%

All Process and Methodology Skills
Scotland

Visualisation falls under the Processes and Methodologies category. For comparison with the information above, the following table provides summary statistics for all permanent job vacancies requiring process or methodology skills in Scotland.

Permanent vacancies with a requirement for process or methodology skills 5,004 3,640 5,626
As % of all permanent jobs advertised in Scotland 87.82% 95.94% 92.38%
Number of salaries quoted 2,133 1,969 3,041
10th Percentile £31,250 £31,555 £31,250
25th Percentile £41,250 £41,250 £41,250
Median annual salary (50th Percentile) £54,000 £55,000 £55,000
Median % change year-on-year -1.82% - +15.79%
75th Percentile £67,500 £71,250 £70,000
90th Percentile £80,000 £82,548 £83,750
UK median annual salary £55,000 £60,000 £60,000
% change year-on-year -8.33% - +9.09%

Visualisation
Job Vacancy Trend in Scotland

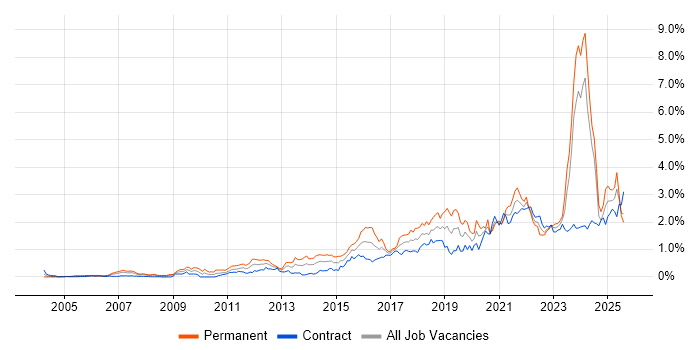
Job postings citing Visualisation as a proportion of all IT jobs advertised in Scotland.

Job vacancy trend for Visualisation in Scotland

Visualisation
Salary Trend in Scotland

3-month moving average salary quoted in jobs citing Visualisation in Scotland.

Salary trend for Visualisation in Scotland

Visualisation
Salary Histogram in Scotland

Salary distribution for jobs citing Visualisation in Scotland over the 6 months to 26 July 2024.

Salary histogram for Visualisation in Scotland

Visualisation
Job Locations in Scotland

The table below looks at the demand and provides a guide to the median salaries quoted in IT jobs citing Visualisation within the Scotland region over the 6 months to 26 July 2024. The 'Rank Change' column provides an indication of the change in demand within each location based on the same 6 month period last year.

Location Rank Change
on Same Period
Last Year
Matching
Permanent
IT Job Ads
Median Salary
Past 6 Months
Median Salary
% Change
on Same Period
Last Year
Live
Jobs
Glasgow +78 601 £47,500 -17.61% 2
Edinburgh +29 34 £80,000 +45.45% 7
West Lothian -10 3 £30,000 -7.69%
East Lothian - 3 - -
Stirling - 2 £32,500 -
Aberdeen - 1 - - 1
Visualisation
UK

Visualisation
Co-occurring Skills and Capabilities in Scotland by Category

The follow tables expand on the table above by listing co-occurrences grouped by category. The same employment type, locality and period is covered with up to 20 co-occurrences shown in each of the following categories:

Application Platforms
1 115 (17.80%) Apache Spark
2 35 (5.42%) Apache
2 35 (5.42%) FileNet
3 3 (0.46%) SAS
3 3 (0.46%) SharePoint
4 2 (0.31%) Tomcat
5 1 (0.15%) Confluence
Applications
1 12 (1.86%) Sketch
2 7 (1.08%) UserZoom
3 6 (0.93%) Microsoft Excel
4 2 (0.31%) AutoCAD
5 1 (0.15%) Microsoft Office
5 1 (0.15%) Microsoft Project
5 1 (0.15%) MS Visio
Cloud Services
1 266 (41.18%) AWS
2 44 (6.81%) Azure
3 41 (6.35%) GCP
4 35 (5.42%) Amazon S3
4 35 (5.42%) Figma
5 32 (4.95%) Cloud Computing
6 29 (4.49%) Amazon EC2
6 29 (4.49%) Amazon ECS
6 29 (4.49%) Amazon EKS
6 29 (4.49%) Amazon EMR
6 29 (4.49%) Amazon SQS
6 29 (4.49%) AWS Lambda
6 29 (4.49%) Serverless
7 25 (3.87%) Google Play
8 19 (2.94%) Datadog
9 18 (2.79%) Power Platform
9 18 (2.79%) SurveyMonkey
10 15 (2.32%) BlazeMeter
11 4 (0.62%) GitHub
12 2 (0.31%) Azure Data Factory
Communications & Networking
1 12 (1.86%) Network Security
Database & Business Intelligence
1 207 (32.04%) NoSQL
2 89 (13.78%) Big Data
3 87 (13.47%) Hadoop
4 60 (9.29%) Apache Hive
4 60 (9.29%) HBase
5 41 (6.35%) Apache Cassandra
6 40 (6.19%) Data Lake
7 35 (5.42%) Elasticsearch
7 35 (5.42%) Qlik Sense
8 31 (4.80%) Relational Database
9 29 (4.49%) Electronic Patient Records
10 18 (2.79%) Power BI
11 11 (1.70%) RDBMS
11 11 (1.70%) Tableau
12 6 (0.93%) Data Warehouse
12 6 (0.93%) MongoDB
13 5 (0.77%) SQL Server
14 4 (0.62%) PostgreSQL
15 3 (0.46%) MySQL
16 2 (0.31%) Snowflake Schema
Development Applications
1 83 (12.85%) JUnit
2 80 (12.38%) Jenkins
3 63 (9.75%) Git
4 60 (9.29%) Bitbucket Server
5 33 (5.11%) JIRA
6 30 (4.64%) Cypress.io
7 25 (3.87%) Android Studio
8 21 (3.25%) Jasmine
8 21 (3.25%) Karma Test Runner
8 21 (3.25%) Protractor
8 21 (3.25%) Selenium
8 21 (3.25%) WebDriver
9 11 (1.70%) Maven
10 9 (1.39%) Cucumber
10 9 (1.39%) Gradle
10 9 (1.39%) JMeter
General
1 608 (94.12%) Inclusion and Diversity
2 598 (92.57%) Finance
3 591 (91.49%) Law
4 350 (54.18%) Legal
5 124 (19.20%) Marketing
6 95 (14.71%) Banking
7 85 (13.16%) Investment Banking
8 59 (9.13%) Social Skills
9 18 (2.79%) Analytical Skills
10 6 (0.93%) Private Banking
11 4 (0.62%) Multimedia
12 3 (0.46%) Publishing
13 2 (0.31%) Manufacturing
13 2 (0.31%) Pharmaceutical
13 2 (0.31%) Public Sector
13 2 (0.31%) Retail
14 1 (0.15%) Games
14 1 (0.15%) Influencing Skills
14 1 (0.15%) Telecoms
Job Titles
1 558 (86.38%) Software Engineer
2 201 (31.11%) Java Engineer
2 201 (31.11%) Java Software Engineer
3 141 (21.83%) AWS Engineer
3 141 (21.83%) AWS Software Engineer
4 106 (16.41%) Data Engineer
5 98 (15.17%) Full Stack Engineer
5 98 (15.17%) Full Stack Software Engineer
6 80 (12.38%) Big Data Engineer
6 80 (12.38%) Big Data Software Engineer
7 75 (11.61%) Python Engineer
7 75 (11.61%) Python Software Engineer
8 46 (7.12%) Developer
9 41 (6.35%) Developer/Software Engineer
10 31 (4.80%) Database Engineer
10 31 (4.80%) Lead
11 30 (4.64%) AWS Database Engineer
11 30 (4.64%) AWS Developer
11 30 (4.64%) Database Developer
12 29 (4.49%) Scala Software Engineer
Libraries, Frameworks & Software Standards
1 161 (24.92%) Spring
2 157 (24.30%) React
3 115 (17.80%) HTML
4 112 (17.34%) AngularJS
5 107 (16.56%) J2EE
6 105 (16.25%) JMS
7 102 (15.79%) Node.js
8 98 (15.17%) Twitter Bootstrap
9 96 (14.86%) CSS
10 86 (13.31%) Hibernate
11 85 (13.16%) Kafka
12 77 (11.92%) JSON
13 75 (11.61%) jQuery
14 43 (6.66%) Spring Boot
14 43 (6.66%) Web Services
15 37 (5.73%) Spring Integration
16 35 (5.42%) GraphQL
16 35 (5.42%) PySpark
17 32 (4.95%) XML
18 30 (4.64%) JavaBeans
Miscellaneous
1 514 (79.57%) Algorithms
2 115 (17.80%) Onboarding
3 103 (15.94%) Cloud Native
4 44 (6.81%) Data Structures
5 26 (4.02%) Management Information System
6 21 (3.25%) Legacy Code
7 20 (3.10%) Market Risk
8 12 (1.86%) Legacy Systems
9 11 (1.70%) Reference Data
10 7 (1.08%) Distributed Denial-of-Service
11 4 (0.62%) Augmented Reality
11 4 (0.62%) Virtual Reality
12 3 (0.46%) Credit Risk
12 3 (0.46%) Self-Motivation
13 2 (0.31%) Life Science
13 2 (0.31%) Private Cloud
13 2 (0.31%) Product Ownership
13 2 (0.31%) Public Cloud
14 1 (0.15%) e-Learning
14 1 (0.15%) Replication
Operating Systems
1 80 (12.38%) Unix
2 33 (5.11%) Linux
3 25 (3.87%) Android
Processes & Methodologies
1 602 (93.19%) Agile
2 587 (90.87%) Software Engineering
3 540 (83.59%) Continuous Improvement
4 525 (81.27%) CI/CD
5 516 (79.88%) SDLC
6 484 (74.92%) Artificial Intelligence
7 476 (73.68%) Community of Practice
8 470 (72.76%) Machine Learning
9 468 (72.45%) Operational Stability
10 358 (55.42%) Risk Management
11 115 (17.80%) Client Onboarding
12 99 (15.33%) Full Stack Development
13 92 (14.24%) KYC
13 92 (14.24%) TDD
14 84 (13.00%) Microservices
15 71 (10.99%) Test Automation
16 66 (10.22%) OO
17 64 (9.91%) Open Source
18 63 (9.75%) Data Visualisation
19 60 (9.29%) Batch Processing
Programming Languages
1 361 (55.88%) Java
2 305 (47.21%) SQL
3 237 (36.69%) Python
4 117 (18.11%) JavaScript
5 85 (13.16%) PL/SQL
6 82 (12.69%) TypeScript
7 30 (4.64%) Scala
8 25 (3.87%) Kotlin
9 4 (0.62%) Shell Script
10 2 (0.31%) Bash
10 2 (0.31%) C++
10 2 (0.31%) Go
10 2 (0.31%) PowerShell
11 1 (0.15%) C
11 1 (0.15%) C#
11 1 (0.15%) Fortran
11 1 (0.15%) R
11 1 (0.15%) T-SQL
Qualifications
1 27 (4.18%) Degree
2 4 (0.62%) Master's Degree
3 2 (0.31%) Computer Science Degree
3 2 (0.31%) PhD
4 1 (0.15%) HND
4 1 (0.15%) SC Cleared
4 1 (0.15%) Security Cleared
Quality Assurance & Compliance
1 12 (1.86%) Accessibility
2 11 (1.70%) QA
3 9 (1.39%) Actionable Recommendations
4 6 (0.93%) Data Quality
5 2 (0.31%) GLP
6 1 (0.15%) NEBOSH
System Software
1 60 (9.29%) HDFS
2 13 (2.01%) Docker
3 2 (0.31%) Apache ZooKeeper
Systems Management
1 75 (11.61%) Kubernetes
2 68 (10.53%) Terraform
3 25 (3.87%) Grafana
4 19 (2.94%) Prometheus
Vendors
1 127 (19.66%) Databricks
2 95 (14.71%) Oracle
3 60 (9.29%) Informatica
4 35 (5.42%) Alteryx
5 31 (4.80%) Google
5 31 (4.80%) Splunk
6 30 (4.64%) Cloudera
7 25 (3.87%) Dynatrace
8 12 (1.86%) ServiceNow
9 9 (1.39%) TOWER Software
10 8 (1.24%) Microsoft
11 7 (1.08%) Qualtrics
12 3 (0.46%) IBM
13 2 (0.31%) Charles River
14 1 (0.15%) Salesforce
14 1 (0.15%) Teradata