Confluence Jobs in Scotland

Confluence
UK > Scotland

The following table provides summary statistics for permanent job vacancies advertised in Scotland with a requirement for Confluence skills. Included is a benchmarking guide to the salaries offered in vacancies that have cited Confluence over the 6 months to 27 April 2024 with a comparison to the same period in the previous 2 years.

6 months to
27 Apr 2024
Same period 2023 Same period 2022
Rank 193 106 144
Rank change year-on-year -87 +38 -11
Permanent jobs citing Confluence 91 121 104
As % of all permanent jobs advertised in Scotland 1.36% 2.55% 1.82%
As % of the Application Platforms category 7.22% 28.40% 12.87%
Number of salaries quoted 43 57 76
10th Percentile £42,439 £44,033 £36,527
25th Percentile £46,875 £54,988 £39,935
Median annual salary (50th Percentile) £62,500 £64,472 £60,000
Median % change year-on-year -3.06% +7.45% +2.13%
75th Percentile £91,934 £77,715 £71,250
90th Percentile £119,695 £108,133 £75,000
UK median annual salary £57,500 £65,000 £62,500
% change year-on-year -11.54% +4.00% -

All Application Platform Skills
Scotland

Confluence is in the Application Platforms category. The following table is for comparison with the above and provides summary statistics for all permanent job vacancies advertised in Scotland with a requirement for application platform skills.

Permanent vacancies with a requirement for application platform skills 1,261 426 808
As % of all permanent jobs advertised in Scotland 18.78% 8.99% 14.16%
Number of salaries quoted 222 270 374
10th Percentile £27,600 £26,250 £28,825
25th Percentile £32,500 £35,000 £36,527
Median annual salary (50th Percentile) £45,500 £50,119 £50,000
Median % change year-on-year -9.22% +0.24% +5.26%
75th Percentile £54,688 £65,000 £65,000
90th Percentile £73,675 £77,715 £71,250
UK median annual salary £50,000 £55,000 £54,000
% change year-on-year -9.09% +1.85% +2.86%

Confluence
Job Vacancy Trend in Scotland

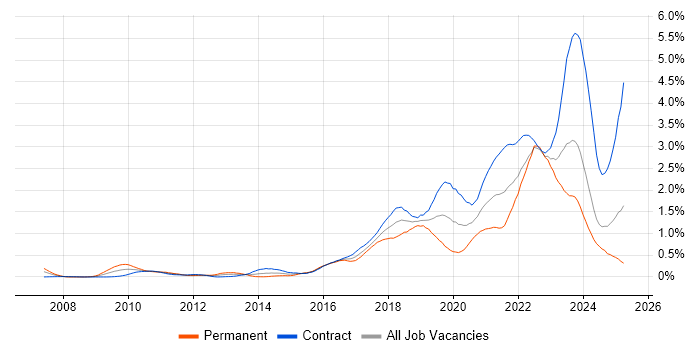
Job postings citing Confluence as a proportion of all IT jobs advertised in Scotland.

Job vacancy trend for Confluence in Scotland

Confluence
Salary Trend in Scotland

3-month moving average salary quoted in jobs citing Confluence in Scotland.

Salary trend for Confluence in Scotland

Confluence
Salary Histogram in Scotland

Salary distribution for jobs citing Confluence in Scotland over the 6 months to 27 April 2024.

Salary histogram for Confluence in Scotland

Confluence
Job Locations in Scotland

The table below looks at the demand and provides a guide to the median salaries quoted in IT jobs citing Confluence within the Scotland region over the 6 months to 27 April 2024. The 'Rank Change' column provides an indication of the change in demand within each location based on the same 6 month period last year.

Location Rank Change
on Same Period
Last Year
Matching
Permanent
IT Job Ads
Median Salary
Past 6 Months
Median Salary
% Change
on Same Period
Last Year
Live
Jobs
Edinburgh -7 47 £59,409 -9.05% 7
Glasgow -78 34 £65,000 +8.33% 2
Fife - 6 - -
West Lothian - 2 £50,000 -
Confluence
UK

Confluence
Co-occurring Skills and Capabilities in Scotland by Category

The follow tables expand on the table above by listing co-occurrences grouped by category. The same employment type, locality and period is covered with up to 20 co-occurrences shown in each of the following categories:

Application Platforms
1 11 (12.09%) SharePoint
Applications
1 12 (13.19%) Microsoft Office
2 9 (9.89%) Microsoft Excel
3 7 (7.69%) Microsoft PowerPoint
4 6 (6.59%) MS Visio
5 1 (1.10%) Microsoft Project
Cloud Services
1 6 (6.59%) AWS
1 6 (6.59%) Dynamics 365
1 6 (6.59%) Microsoft 365
1 6 (6.59%) Power Platform
1 6 (6.59%) Yammer
2 5 (5.49%) Azure
2 5 (5.49%) GCP
3 4 (4.40%) Miro
4 2 (2.20%) OpenShift
4 2 (2.20%) SaaS
5 1 (1.10%) Adobe Analytics
5 1 (1.10%) Amazon EC2
5 1 (1.10%) Apigee
5 1 (1.10%) AWS CloudFormation
5 1 (1.10%) AWS Fargate
5 1 (1.10%) AWS Lambda
5 1 (1.10%) npm
5 1 (1.10%) Route 53
5 1 (1.10%) Serverless
5 1 (1.10%) Smartsheet
Communications & Networking
1 4 (4.40%) Network Security
Database & Business Intelligence
1 6 (6.59%) Power BI
2 5 (5.49%) MongoDB
3 4 (4.40%) PostgreSQL
4 3 (3.30%) MySQL
5 2 (2.20%) NoSQL
6 1 (1.10%) Elasticsearch
6 1 (1.10%) Electronic Patient Records
6 1 (1.10%) InfluxDB
6 1 (1.10%) Oracle Database
6 1 (1.10%) Tableau
Development Applications
1 91 (100.00%) JIRA
2 18 (19.78%) Bitbucket
3 16 (17.58%) Git
4 8 (8.79%) Jenkins
5 6 (6.59%) Cypress.io
5 6 (6.59%) MSTest
5 6 (6.59%) Visual Studio
6 3 (3.30%) GitLab
7 2 (2.20%) Cucumber
7 2 (2.20%) Maven
8 1 (1.10%) Artifactory
8 1 (1.10%) Gradle
8 1 (1.10%) IBM UrbanCode
8 1 (1.10%) JMeter
8 1 (1.10%) JUnit
8 1 (1.10%) LoadRunner
8 1 (1.10%) Oracle Forms
8 1 (1.10%) Selenium
8 1 (1.10%) Sonatype Nexus
8 1 (1.10%) Spinnaker
General
1 51 (56.04%) Finance
2 38 (41.76%) Inclusion and Diversity
3 30 (32.97%) Social Skills
4 27 (29.67%) Law
5 25 (27.47%) Marketing
6 22 (24.18%) Analytical Skills
7 19 (20.88%) Banking
8 3 (3.30%) Organisational Skills
9 2 (2.20%) Influencing Skills
9 2 (2.20%) Police
10 1 (1.10%) Retail
Job Titles
1 22 (24.18%) Analyst
2 17 (18.68%) Lead
3 16 (17.58%) Agile Coach
3 16 (17.58%) Business Analyst
3 16 (17.58%) Senior
4 14 (15.38%) Test Engineer
5 8 (8.79%) Hardware Engineer
5 8 (8.79%) Hardware Test Engineer
6 7 (7.69%) Market Risk Analyst
6 7 (7.69%) Market Risk Business Analyst
6 7 (7.69%) Risk Analyst
6 7 (7.69%) Risk Business Analyst
7 6 (6.59%) Change Analyst
7 6 (6.59%) Governance Analyst
7 6 (6.59%) Service Analyst
7 6 (6.59%) Software Engineer
7 6 (6.59%) Software Test Engineer
8 5 (5.49%) Consultant
8 5 (5.49%) Enterprise Architecture Consultant
8 5 (5.49%) Enterprise Consultant
Libraries, Frameworks & Software Standards
1 11 (12.09%) RESTful
2 10 (10.99%) Node.js
3 8 (8.79%) React
4 6 (6.59%) CSS
5 5 (5.49%) .NET
5 5 (5.49%) HTML
5 5 (5.49%) Middleware
5 5 (5.49%) Spring
6 4 (4.40%) AngularJS
6 4 (4.40%) Web Services
7 3 (3.30%) Express.js
7 3 (3.30%) MEAN Stack
7 3 (3.30%) MERN Stack
7 3 (3.30%) Spring Boot
8 2 (2.20%) .NET Framework
8 2 (2.20%) REST
9 1 (1.10%) J2EE
9 1 (1.10%) JSON
9 1 (1.10%) RabbitMQ
9 1 (1.10%) SOAP
Miscellaneous
1 17 (18.68%) Product Ownership
2 7 (7.69%) Market Risk
3 6 (6.59%) IoT
4 5 (5.49%) Public Cloud
5 4 (4.40%) Cloud Native
5 4 (4.40%) Enterprise Storage
6 2 (2.20%) Driving Licence
6 2 (2.20%) Onboarding
7 1 (1.10%) Foreign Exchange (FX)
7 1 (1.10%) Reference Data
Operating Systems
1 4 (4.40%) Mac OS X
2 1 (1.10%) Linux
2 1 (1.10%) Red Hat Enterprise Linux
2 1 (1.10%) Ubuntu
Processes & Methodologies
1 88 (96.70%) Agile
2 33 (36.26%) DevOps
3 31 (34.07%) Continuous Improvement
4 29 (31.87%) Scrum
5 27 (29.67%) Problem-Solving
6 21 (23.08%) Coaching
6 21 (23.08%) Mentoring
6 21 (23.08%) Software Engineering
7 20 (21.98%) Scaled Agile Framework
7 20 (21.98%) Servant Leadership
7 20 (21.98%) Test Automation
8 18 (19.78%) Software Testing
8 18 (19.78%) Test Management
9 17 (18.68%) IT Strategy
9 17 (18.68%) Technology Strategy
10 16 (17.58%) Agile Coaching
10 16 (17.58%) Product Backlog
10 16 (17.58%) Product Vision
10 16 (17.58%) Systems Thinking
11 15 (16.48%) Business Analysis
Programming Languages
1 14 (15.38%) SQL
2 11 (12.09%) JavaScript
3 9 (9.89%) Java
4 6 (6.59%) Python
5 5 (5.49%) C#
6 3 (3.30%) C++
6 3 (3.30%) TypeScript
6 3 (3.30%) VBA
7 2 (2.20%) Bash
7 2 (2.20%) Groovy
8 1 (1.10%) PL/SQL
8 1 (1.10%) PowerShell
8 1 (1.10%) Scala
Qualifications
1 40 (43.96%) Degree
2 8 (8.79%) SC Cleared
2 8 (8.79%) Security Cleared
3 5 (5.49%) Master's Degree
4 4 (4.40%) Computer Science Degree
5 1 (1.10%) CBAP
5 1 (1.10%) OCP
5 1 (1.10%) Oracle Certification
Quality Assurance & Compliance
1 15 (16.48%) QA
2 12 (13.19%) ISO 9001
3 3 (3.30%) PMO
4 1 (1.10%) Disclosure Scotland
4 1 (1.10%) SLA
System Software
1 2 (2.20%) Docker
Systems Management
1 9 (9.89%) Kubernetes
2 6 (6.59%) Ansible
3 4 (4.40%) vRealize
3 4 (4.40%) vRealize Orchestrator
4 2 (2.20%) Istio
4 2 (2.20%) Terraform
5 1 (1.10%) Grafana
5 1 (1.10%) Kibana
5 1 (1.10%) Progress Chef
5 1 (1.10%) Puppet
Vendors
1 19 (20.88%) Microsoft
2 15 (16.48%) ServiceNow
3 12 (13.19%) Atlassian
4 5 (5.49%) BiZZdesign
5 4 (4.40%) Dell
6 2 (2.20%) Cadence
6 2 (2.20%) Oracle
7 1 (1.10%) Adobe
7 1 (1.10%) Dynatrace
7 1 (1.10%) Google
7 1 (1.10%) Red Hat