Banking Jobs in Scotland

Banking
UK > Scotland

The table below looks at the prevalence of the term Banking in permanent job vacancies advertised in Scotland. Included is a benchmarking guide to the salaries offered in vacancies that have cited Banking over the 6 months to 30 November 2023 with a comparison to the same period over the previous 2 years.

6 months to
30 Nov 2023
Same period 2022 Same period 2021
Rank 10 17 64
Rank change year-on-year +7 +47 -6
Permanent jobs citing Banking 408 719 190
As % of all permanent jobs advertised in Scotland 14.30% 14.20% 4.09%
As % of the General category 19.23% 20.10% 6.85%
Number of salaries quoted 345 396 132
10th Percentile £46,306 £41,227 £35,800
25th Percentile £57,887 £53,218 £41,250
Median annual salary (50th Percentile) £70,576 £66,928 £52,958
Median % change year-on-year +5.45% +26.38% +5.92%
75th Percentile £84,056 £79,250 £70,000
90th Percentile £96,539 £97,319 £80,000
UK median annual salary £75,000 £75,000 £75,000

All General Skills
Scotland

Banking is in the General Skills category. The following table is for comparison with the above and provides summary statistics for all permanent job vacancies advertised in Scotland with a requirement for common skills.

Permanent vacancies with a requirement for common skills 2,122 3,577 2,773
As % of all permanent jobs advertised in Scotland 74.38% 70.62% 59.67%
Number of salaries quoted 1,419 1,925 1,604
10th Percentile £25,000 £32,600 £28,750
25th Percentile £32,500 £41,250 £37,500
Median annual salary (50th Percentile) £52,500 £57,400 £50,000
Median % change year-on-year -8.54% +14.80% +5.26%
75th Percentile £71,250 £75,000 £62,500
90th Percentile £84,056 £85,000 £75,000
UK median annual salary £60,000 £60,000 £57,500
% change year-on-year - +4.35% +4.55%

Banking
Job Vacancy Trend in Scotland

Job postings citing Banking as a proportion of all IT jobs advertised in Scotland.
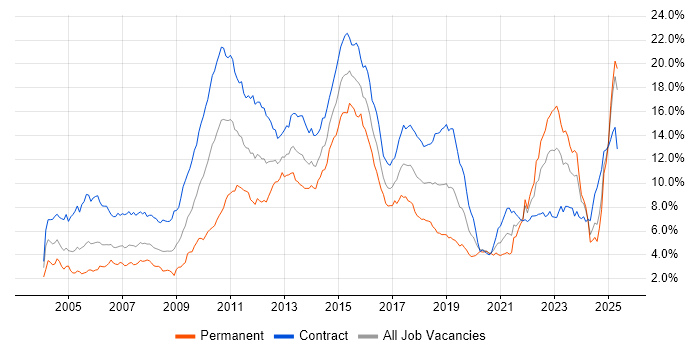
Job vacancy trend for Banking in Scotland

Banking
Salary Trend in Scotland

3-month moving average salary quoted in jobs citing Banking in Scotland.

Salary trend for Banking in Scotland

Banking
Salary Histogram in Scotland

Salary distribution for jobs citing Banking in Scotland over the 6 months to 30 November 2023.

Salary histogram for Banking in Scotland

Banking
Job Locations in Scotland

The table below looks at the demand and provides a guide to the median salaries quoted in IT jobs citing Banking within the Scotland region over the 6 months to 30 November 2023. The 'Rank Change' column provides an indication of the change in demand within each location based on the same 6 month period last year.

Location Rank Change
on Same Period
Last Year
Matching
Permanent
IT Job Ads
Median Salary
Past 6 Months
Median Salary
% Change
on Same Period
Last Year
Live
Jobs
Edinburgh -1 346 £70,576 +5.67% 17
Glasgow +33 41 £60,249 -13.93% 11
Dundee - 10 £47,557 -
West Lothian +8 6 £45,000 -
Banking
UK

Banking
Co-occurring Skills and Capabilities in Scotland by Category

The follow tables expand on the table above by listing co-occurrences grouped by category. The same employment type, locality and period is covered with up to 20 co-occurrences shown in each of the following categories:

Application Platforms
1 31 (7.60%) Confluence
2 13 (3.19%) SAS
3 12 (2.94%) Apache Spark
4 11 (2.70%) WebSphere
5 8 (1.96%) SharePoint
6 7 (1.72%) Apache
7 6 (1.47%) WebSphere Application Server
8 5 (1.23%) IIS
9 4 (0.98%) Tomcat
10 3 (0.74%) Captiva
10 3 (0.74%) CMS
10 3 (0.74%) FileNet
10 3 (0.74%) IBM HTTP Server
10 3 (0.74%) Jetty
11 1 (0.25%) Oracle HTTP Server
Applications
1 22 (5.39%) Microsoft Excel
2 21 (5.15%) Microsoft Office
3 8 (1.96%) Microsoft PowerPoint
4 1 (0.25%) EViews
4 1 (0.25%) SPSS
Business Applications
1 4 (0.98%) SAP GRC
2 3 (0.74%) Oracle Cash Management
Cloud Services
1 98 (24.02%) GCP
2 75 (18.38%) Azure
3 51 (12.50%) SaaS
4 46 (11.27%) PaaS
5 43 (10.54%) GitHub
6 40 (9.80%) Power Platform
7 36 (8.82%) AWS
8 25 (6.13%) IaaS
9 15 (3.68%) Azure DevOps
10 14 (3.43%) Google Kubernetes Engine
11 12 (2.94%) Microsoft 365
12 11 (2.70%) GitHub Actions
13 10 (2.45%) Azure Sentinel
14 8 (1.96%) Azure API Management
14 8 (1.96%) Azure Functions
14 8 (1.96%) Serverless
15 7 (1.72%) Vertex AI
15 7 (1.72%) Yammer
16 5 (1.23%) AWS Direct Connect
16 5 (1.23%) Azure Cosmos DB
Communications & Networking
1 8 (1.96%) Firewall
2 5 (1.23%) Internet
2 5 (1.23%) VPN
3 4 (0.98%) F5 BIG-IP GTM
3 4 (0.98%) F5 BIG-IP LTM
4 2 (0.49%) Network Security
5 1 (0.25%) DNS
5 1 (0.25%) DSL
5 1 (0.25%) HTTP
5 1 (0.25%) SSL
5 1 (0.25%) TCP/IP
Database & Business Intelligence
1 40 (9.80%) Power BI
2 36 (8.82%) Data Warehouse
3 34 (8.33%) NoSQL
4 29 (7.11%) Big Data
5 25 (6.13%) Data Lake
6 19 (4.66%) BigQuery
6 19 (4.66%) SQL Server
7 16 (3.92%) MySQL
8 15 (3.68%) PostgreSQL
8 15 (3.68%) Tableau
9 11 (2.70%) MongoDB
9 11 (2.70%) SQL Server Integration Services
9 11 (2.70%) SQL Server Reporting Services
10 9 (2.21%) Relational Database
11 7 (1.72%) Oracle Database
12 6 (1.47%) SAP HANA
13 5 (1.23%) Bigtable
13 5 (1.23%) Data Hub
13 5 (1.23%) Looker
13 5 (1.23%) Metadata
Development Applications
1 72 (17.65%) Jenkins
2 43 (10.54%) Git
3 42 (10.29%) JIRA
4 20 (4.90%) IBM UrbanCode
4 20 (4.90%) Sonatype Nexus
5 19 (4.66%) Maven
6 18 (4.41%) Selenium
7 16 (3.92%) Cucumber
8 13 (3.19%) SonarQube
9 11 (2.70%) Spinnaker
10 9 (2.21%) Oracle Forms
11 7 (1.72%) JUnit
11 7 (1.72%) LoadRunner
12 6 (1.47%) Mocha
12 6 (1.47%) Zephyr
13 5 (1.23%) CA Release Automation
13 5 (1.23%) Cypress.io
13 5 (1.23%) Subversion
13 5 (1.23%) Team Foundation Server
14 3 (0.74%) Karma Test Runner
General
1 389 (95.34%) Finance
2 134 (32.84%) Social Skills
3 63 (15.44%) Retail
4 61 (14.95%) Analytical Skills
5 33 (8.09%) Inclusion and Diversity
6 27 (6.62%) Legal
7 26 (6.37%) Retail Banking
8 25 (6.13%) Marketing
9 23 (5.64%) Games
10 22 (5.39%) Influencing Skills
11 11 (2.70%) Presentation Skills
12 10 (2.45%) Investment Banking
12 10 (2.45%) Law
13 7 (1.72%) Organisational Skills
14 6 (1.47%) Private Banking
15 5 (1.23%) Financial Institution
16 3 (0.74%) Front Office
17 2 (0.49%) Manufacturing
18 1 (0.25%) Back Office
18 1 (0.25%) Retail Finance
Job Titles
1 130 (31.86%) Architect
2 67 (16.42%) Solutions Architect
3 59 (14.46%) Senior
4 57 (13.97%) Software Engineer
5 42 (10.29%) Analyst
6 39 (9.56%) Lead
7 29 (7.11%) Enterprise Architect
7 29 (7.11%) Security Architect
8 23 (5.64%) DevOps Engineer
9 22 (5.39%) Cloud Engineer
10 21 (5.15%) Security Engineer
11 18 (4.41%) Developer
12 15 (3.68%) Infrastructure Engineer
12 15 (3.68%) Senior Analyst
12 15 (3.68%) Senior DevOps
12 15 (3.68%) Senior DevOps Engineer
13 13 (3.19%) Cloud Security Engineer
13 13 (3.19%) Full Stack Engineer
14 12 (2.94%) Commercial Architect
14 12 (2.94%) Data Architect
Libraries, Frameworks & Software Standards
1 60 (14.71%) Spring Boot
2 54 (13.24%) Kafka
3 48 (11.76%) Spring
4 32 (7.84%) React
5 31 (7.60%) RESTful
6 30 (7.35%) HTML
6 30 (7.35%) Node.js
7 26 (6.37%) AngularJS
8 24 (5.88%) REST
9 23 (5.64%) OpenID
10 20 (4.90%) CSS
10 20 (4.90%) JSON
11 19 (4.66%) .NET
12 18 (4.41%) Middleware
13 15 (3.68%) Web Services
14 14 (3.43%) Express.js
15 10 (2.45%) MEAN Stack
15 10 (2.45%) MERN Stack
15 10 (2.45%) SOAP
16 8 (1.96%) XML
Miscellaneous
1 60 (14.71%) Public Cloud
2 58 (14.22%) Product Ownership
3 36 (8.82%) Blockchain
4 30 (7.35%) Mainframe
5 28 (6.86%) Cloud Native
6 23 (5.64%) Robotics
7 20 (4.90%) Private Cloud
8 17 (4.17%) SWIFT Messaging Network
9 14 (3.43%) Data Structures
10 13 (3.19%) Credit Risk
11 11 (2.70%) Data Centre
11 11 (2.70%) Virtual Team
12 9 (2.21%) Mobile Banking
13 7 (1.72%) Hybrid Cloud
14 5 (1.23%) Online Banking
15 4 (0.98%) Algorithms
15 4 (0.98%) CCTV
15 4 (0.98%) Legacy Systems
15 4 (0.98%) Linux Command Line
15 4 (0.98%) Onboarding
Operating Systems
1 30 (7.35%) Unix
2 24 (5.88%) Linux
3 17 (4.17%) Windows
4 7 (1.72%) Red Hat Enterprise Linux
4 7 (1.72%) zOS
5 4 (0.98%) Windows Server
6 3 (0.74%) HPUX
6 3 (0.74%) Solaris
7 1 (0.25%) CoreOS
Processes & Methodologies
1 360 (88.24%) Agile
2 113 (27.70%) DevOps
3 106 (25.98%) Microservices
4 87 (21.32%) Analytics
5 83 (20.34%) Roadmaps
6 75 (18.38%) Problem-Solving
6 75 (18.38%) Software Engineering
7 68 (16.67%) Mentoring
8 67 (16.42%) Coaching
9 64 (15.69%) CI/CD
10 60 (14.71%) Artificial Intelligence
10 60 (14.71%) Containerisation
11 58 (14.22%) Enterprise Architecture
12 56 (13.73%) Cybersecurity
13 54 (13.24%) Machine Learning
13 54 (13.24%) SDLC
14 53 (12.99%) Continuous Improvement
15 48 (11.76%) Technical Leadership
16 45 (11.03%) Event-Driven
16 45 (11.03%) Infrastructure as Code
Programming Languages
1 92 (22.55%) Java
2 85 (20.83%) SQL
3 82 (20.10%) Python
4 40 (9.80%) JavaScript
5 19 (4.66%) Bash
6 16 (3.92%) C#
7 15 (3.68%) PowerShell
8 13 (3.19%) Groovy
9 8 (1.96%) T-SQL
9 8 (1.96%) VBA
10 7 (1.72%) TypeScript
11 6 (1.47%) R
11 6 (1.47%) Scala
12 5 (1.23%) SOQL
13 3 (0.74%) Assembly Language
13 3 (0.74%) COBOL
13 3 (0.74%) JCL
13 3 (0.74%) PL/1
13 3 (0.74%) REXX
13 3 (0.74%) Shell Script
Qualifications
1 23 (5.64%) Security Cleared
2 19 (4.66%) Degree
3 12 (2.94%) Azure Certification
4 9 (2.21%) AWS Certification
5 6 (1.47%) OCP
5 6 (1.47%) Oracle Certification
6 5 (1.23%) CISMP
6 5 (1.23%) TOGAF Certification
7 2 (0.49%) Computer Science Degree
8 1 (0.25%) CISA
8 1 (0.25%) CISSP
8 1 (0.25%) ISTQB
Quality Assurance & Compliance
1 19 (4.66%) SEPA
2 18 (4.41%) Data Quality
3 7 (1.72%) GDPR
4 6 (1.47%) ISO 20022
5 5 (1.23%) Actionable Recommendations
5 5 (1.23%) GRC
6 4 (0.98%) IFRS
6 4 (0.98%) IFRS 9
7 3 (0.74%) Accessibility
7 3 (0.74%) CRD IV
8 2 (0.49%) NIST
8 2 (0.49%) SLA
9 1 (0.25%) Basel III
9 1 (0.25%) PMO
9 1 (0.25%) QA
9 1 (0.25%) WAI
System Software
1 63 (15.44%) Docker
2 28 (6.86%) Virtual Machines
3 5 (1.23%) BitLocker
4 1 (0.25%) Oracle RAC
Systems Management
1 93 (22.79%) Kubernetes
2 62 (15.20%) Terraform
3 13 (3.19%) Istio
4 8 (1.96%) Ansible
5 6 (1.47%) Kibana
5 6 (1.47%) Nagios
5 6 (1.47%) Prometheus
5 6 (1.47%) Puppet
6 5 (1.23%) Active Directory Federation Services
7 4 (0.98%) Progress Chef
8 3 (0.74%) Rancher
9 1 (0.25%) CA Endevor
9 1 (0.25%) Data Guard
9 1 (0.25%) Grafana
9 1 (0.25%) Oracle RMAN
Vendors
1 57 (13.97%) Google
2 27 (6.62%) Microsoft
3 21 (5.15%) IBM
4 19 (4.66%) Dynatrace
4 19 (4.66%) ServiceNow
5 14 (3.43%) Splunk
6 12 (2.94%) Oracle
7 10 (2.45%) Teradata
8 9 (2.21%) Salesforce
8 9 (2.21%) SAP
9 8 (1.96%) Atlassian
9 8 (1.96%) HP
9 8 (1.96%) Veracode
10 6 (1.47%) New Relic
11 4 (0.98%) Confluent
11 4 (0.98%) Databricks
11 4 (0.98%) F5
11 4 (0.98%) Fortinet
11 4 (0.98%) Pega
11 4 (0.98%) VMware