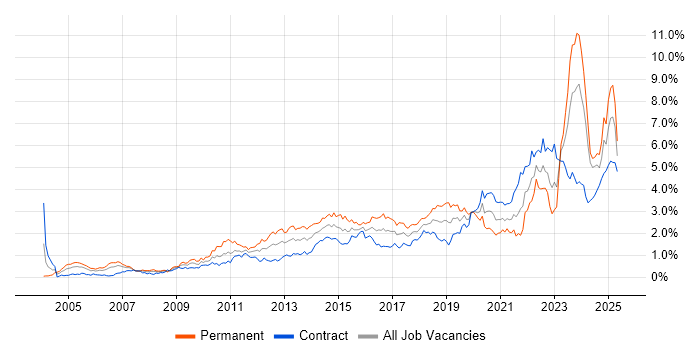
Decision-Making Job Trends in Scotland

Decision-Making
UK > Scotland

The table below provides summary statistics and salary benchmarking for jobs advertised in Scotland requiring Decision-Making skills. It covers vacancies from the 6 months leading up to 18 September 2025, with comparisons to the same periods in the previous two years.

6 months to
18 Sep 2025
Same period 2024 Same period 2023
Rank 26 36 22
Rank change year-on-year +10 -14 +28
Permanent jobs citing Decision-Making 230 291 253
As % of all permanent jobs advertised in Scotland 9.01% 6.75% 9.52%
As % of the Processes & Methodologies category 10.02% 7.88% 9.93%
Number of salaries quoted 43 45 229
10th Percentile £43,250 £36,250 -
25th Percentile £50,000 £38,750 -
Median annual salary (50th Percentile) £54,855 £50,000 £25,000
Median % change year-on-year +9.71% +100.00% -49.86%
75th Percentile £71,532 £67,500 £26,000
90th Percentile £83,738 £98,474 £63,016
UK median annual salary £60,000 £55,213 £55,006
% change year-on-year +8.67% +0.38% -8.32%

All Process and Methodology Skills
Scotland

Decision-Making falls under the Processes and Methodologies category. For comparison with the information above, the following table provides summary statistics for all permanent job vacancies requiring process or methodology skills in Scotland.

Permanent vacancies with a requirement for process or methodology skills 2,296 3,695 2,548
As % of all permanent jobs advertised in Scotland 89.90% 85.65% 95.86%
Number of salaries quoted 1,003 1,596 1,991
10th Percentile £26,794 £31,250 £25,000
25th Percentile £32,000 £41,489 £37,500
Median annual salary (50th Percentile) £38,000 £55,000 £52,500
Median % change year-on-year -30.91% +4.76% -4.55%
75th Percentile £61,250 £70,000 £70,000
90th Percentile £77,500 £81,750 £82,500
UK median annual salary £55,000 £57,500 £60,000
% change year-on-year -4.35% -4.17% -

Decision-Making
Job Vacancy Trend in Scotland

Job postings citing Decision-Making as a proportion of all IT jobs advertised in Scotland.

Job vacancy trend for Decision-Making in Scotland

Decision-Making
Salary Trend in Scotland

Salary distribution trend for jobs in Scotland citing Decision-Making.

Salary distribution trend for jobs in Scotland citing Decision-Making

Decision-Making
Salary Histogram in Scotland

Salary distribution for jobs citing Decision-Making in Scotland over the 6 months to 18 September 2025.

Salary histogram for Decision-Making in Scotland

Decision-Making
Job Locations in Scotland

The table below looks at the demand and provides a guide to the median salaries quoted in IT jobs citing Decision-Making within the Scotland region over the 6 months to 18 September 2025. The 'Rank Change' column provides an indication of the change in demand within each location based on the same 6 month period last year.

Location Rank Change
on Same Period
Last Year
Matching
Permanent
IT Job Ads
Median Salary
Past 6 Months
Median Salary
% Change
on Same Period
Last Year
Live
Jobs
Glasgow -1 72 £52,500 +16.67% 18
Edinburgh +16 66 £58,750 -9.62% 28
North Lanarkshire +3 20 - -
Renfrewshire +3 16 £51,645 +9.38% 4
South Lanarkshire - 10 - - 3
West Lothian - 9 £50,000 -
Stirling +4 6 - -
West Dunbartonshire - 6 £60,000 -
North Ayrshire - 5 - -
East Ayrshire - 5 - -
Ayrshire - 5 - -
Lanarkshire - 5 - - 7
Inverclyde - 2 £51,645 -
Aberdeen +18 1 - - 2
Dundee +9 1 £69,248 +76.00%
Fife - 1 £50,000 - 2
Decision-Making
UK

Decision-Making
Co-occurring Skills and Capabilities in Scotland by Category

The follow tables expand on the table above by listing co-occurrences grouped by category. The same employment type, locality and period is covered with up to 20 co-occurrences shown in each of the following categories:

Application Platforms
1 9 (3.91%) Apache Spark
Applications
1 6 (2.61%) Microsoft Excel
1 6 (2.61%) Microsoft Office
2 3 (1.30%) Microsoft PowerPoint
Cloud Services
1 39 (16.96%) AWS
2 19 (8.26%) Azure
3 13 (5.65%) Power Platform
4 12 (5.22%) Snowflake
5 6 (2.61%) Microsoft 365
6 4 (1.74%) Amazon SageMaker
6 4 (1.74%) GitHub
6 4 (1.74%) SaaS
7 3 (1.30%) AWS Lambda
7 3 (1.30%) Azure DevOps
7 3 (1.30%) Serverless
8 2 (0.87%) Amazon S3
8 2 (0.87%) Collibra
8 2 (0.87%) Microsoft Purview
9 1 (0.43%) Amazon EC2
9 1 (0.43%) Azure Data Factory
9 1 (0.43%) BlazeMeter
9 1 (0.43%) Dynamics 365
9 1 (0.43%) Microsoft Copilot
9 1 (0.43%) PaaS
Communications & Networking
1 2 (0.87%) FTP
2 1 (0.43%) Network Security
Database & Business Intelligence
1 13 (5.65%) Tableau
2 12 (5.22%) Power BI
3 11 (4.78%) Relational Database
4 10 (4.35%) PostgreSQL
5 9 (3.91%) Apache Hive
5 9 (3.91%) Big Data
6 6 (2.61%) NoSQL
7 5 (2.17%) Apache Cassandra
7 5 (2.17%) Data Warehouse
7 5 (2.17%) DynamoDB
7 5 (2.17%) Hadoop
7 5 (2.17%) HBase
8 4 (1.74%) Amazon Athena
8 4 (1.74%) Amazon Redshift
8 4 (1.74%) Apache Iceberg
8 4 (1.74%) Impala
8 4 (1.74%) KDB
8 4 (1.74%) Kdb+
8 4 (1.74%) Oracle Database
8 4 (1.74%) Redshift Spectrum
Development Applications
1 5 (2.17%) Gradle
1 5 (2.17%) Maven
2 4 (1.74%) Jenkins
3 3 (1.30%) Git
3 3 (1.30%) JIRA
4 2 (0.87%) ERwin
4 2 (0.87%) JUnit
General
1 114 (49.57%) Social Skills
2 111 (48.26%) Analytical Skills
3 93 (40.43%) Finance
4 60 (26.09%) Inclusion and Diversity
5 57 (24.78%) Law
6 32 (13.91%) Marketing
7 29 (12.61%) Banking
8 14 (6.09%) Legal
9 10 (4.35%) Presentation Skills
10 9 (3.91%) Private Banking
11 7 (3.04%) Front Office
11 7 (3.04%) Retail
12 6 (2.61%) Public Sector
12 6 (2.61%) Publishing
13 4 (1.74%) Brand Awareness
13 4 (1.74%) Investment Banking
14 3 (1.30%) Advertising
14 3 (1.30%) Influencing Skills
14 3 (1.30%) Manufacturing
15 2 (0.87%) Organisational Skills
Job Titles
1 80 (34.78%) Innovation Manager
2 54 (23.48%) Software Engineer
3 32 (13.91%) Java Engineer
3 32 (13.91%) Java Software Engineer
4 22 (9.57%) Lead
5 17 (7.39%) Full-Stack Engineer
5 17 (7.39%) Full-Stack Software Engineer
5 17 (7.39%) Senior
6 16 (6.96%) Analyst
7 15 (6.52%) Developer
7 15 (6.52%) Lead Software Engineer
7 15 (6.52%) Python Engineer
7 15 (6.52%) Python Software Engineer
8 11 (4.78%) Java Developer
9 10 (4.35%) Full-Stack Developer
10 9 (3.91%) Developer/Software Engineer
10 9 (3.91%) Full-Stack Java Developer
10 9 (3.91%) Java Software Developer
10 9 (3.91%) Software Developer
11 8 (3.48%) Financial Controller
Libraries, Frameworks & Software Standards
1 23 (10.00%) Spring
2 16 (6.96%) Spring Boot
3 13 (5.65%) Kafka
3 13 (5.65%) React
4 10 (4.35%) RESTful
5 9 (3.91%) AngularJS
6 8 (3.48%) REST
7 5 (2.17%) JPA
7 5 (2.17%) PySpark
8 1 (0.43%) .NET
8 1 (0.43%) CSS
8 1 (0.43%) HTML
Miscellaneous
1 18 (7.83%) Cloud Native
2 8 (3.48%) Reference Data
3 5 (2.17%) FMCG
3 5 (2.17%) Legacy Systems
4 4 (1.74%) Derivative
4 4 (1.74%) Distributed Applications
4 4 (1.74%) Management Information System
4 4 (1.74%) Public Cloud
5 3 (1.30%) Digital Media
5 3 (1.30%) Operational Technology
5 3 (1.30%) Product Ownership
5 3 (1.30%) Social Media
6 2 (0.87%) AS400
6 2 (0.87%) iSeries
6 2 (0.87%) Onboarding
6 2 (0.87%) Replication
7 1 (0.43%) Cyber Threat
7 1 (0.43%) Equity Derivative
7 1 (0.43%) Renewable Energy
7 1 (0.43%) SCADA
Operating Systems
1 6 (2.61%) Unix
2 1 (0.43%) Linux
Processes & Methodologies
1 150 (65.22%) Artificial Intelligence
2 111 (48.26%) Analytics
3 99 (43.04%) Continuous Improvement
4 97 (42.17%) Stakeholder Management
5 85 (36.96%) Data-Driven Decision Making
6 83 (36.09%) Customer Experience
7 71 (30.87%) Agile
8 54 (23.48%) Software Engineering
9 53 (23.04%) Operational Stability
10 50 (21.74%) SDLC
11 48 (20.87%) Machine Learning
12 44 (19.13%) CI/CD
12 44 (19.13%) Problem-Solving
13 32 (13.91%) Critical Thinking
13 32 (13.91%) Emotional Intelligence
14 25 (10.87%) Risk Management
15 21 (9.13%) Business Intelligence
15 21 (9.13%) Data Engineering
16 20 (8.70%) Full-Stack Development
17 18 (7.83%) Visualisation
Programming Languages
1 43 (18.70%) SQL
2 39 (16.96%) Java
3 32 (13.91%) Python
4 8 (3.48%) PL/SQL
5 4 (1.74%) T-SQL
5 4 (1.74%) TypeScript
6 2 (0.87%) RPG
6 2 (0.87%) RPG IV
7 1 (0.43%) Data Analysis Expressions
7 1 (0.43%) JavaScript
7 1 (0.43%) Scala
Qualifications
1 11 (4.78%) Degree
2 4 (1.74%) BPSS Clearance
3 2 (0.87%) ACCA
3 2 (0.87%) CIMA
3 2 (0.87%) SC Cleared
3 2 (0.87%) Security Cleared
4 1 (0.43%) AWS Certification
4 1 (0.43%) Azure Certification
4 1 (0.43%) CISM
4 1 (0.43%) CISSP
4 1 (0.43%) Computer Science Degree
4 1 (0.43%) HNC
4 1 (0.43%) HND
4 1 (0.43%) Microsoft Certification
Quality Assurance & Compliance
1 7 (3.04%) Data Quality
2 6 (2.61%) Accessibility
2 6 (2.61%) GDPR
3 4 (1.74%) ISO/IEC 27001
4 3 (1.30%) Actionable Recommendations
4 3 (1.30%) GAAP
4 3 (1.30%) GRC
4 3 (1.30%) IFRS
4 3 (1.30%) QA
4 3 (1.30%) Solvency II
5 2 (0.87%) NIST
6 1 (0.43%) ISO 20022
6 1 (0.43%) ITGC
6 1 (0.43%) NCSC
System Software
1 5 (2.17%) HDFS
Systems Management
1 6 (2.61%) Kubernetes
2 5 (2.17%) Grafana
2 5 (2.17%) Terraform
3 4 (1.74%) Netcool
3 4 (1.74%) Netcool/OMNIbus
3 4 (1.74%) Tivoli
Vendors
1 18 (7.83%) Oracle
2 13 (5.65%) Microsoft
3 9 (3.91%) Databricks
4 7 (3.04%) IBM
5 6 (2.61%) Alteryx
6 5 (2.17%) Cloudera
6 5 (2.17%) Dynatrace
6 5 (2.17%) Splunk
7 4 (1.74%) ServiceNow
8 2 (0.87%) Charles River
8 2 (0.87%) Informatica
8 2 (0.87%) Teradata
8 2 (0.87%) Xero
9 1 (0.43%) Planview
9 1 (0.43%) Siemens
9 1 (0.43%) Sybase