SQL Server Jobs in Scotland

Microsoft SQL Server (MS SQL)
UK > Scotland

The following table provides summary statistics for permanent job vacancies advertised in Scotland with a requirement for SQL Server skills. Included is a benchmarking guide to the salaries offered in vacancies that have cited SQL Server over the 6 months to 6 December 2023 with a comparison to the same period in the previous 2 years.

6 months to
6 Dec 2023
Same period 2022 Same period 2021
Rank 52 69 32
Rank change year-on-year +17 -37 -12
Permanent jobs citing SQL Server 182 221 356
As % of all permanent jobs advertised in Scotland 6.20% 4.42% 7.75%
As % of the Database & Business Intelligence category 27.79% 20.83% 30.58%
Number of salaries quoted 149 153 234
10th Percentile £31,250 £30,000 £27,863
25th Percentile £36,250 £35,250 £36,250
Median annual salary (50th Percentile) £52,000 £50,000 £45,000
Median % change year-on-year +4.00% +11.11% -7.69%
75th Percentile £63,750 £62,500 £53,750
90th Percentile £67,500 £71,000 £62,500
UK median annual salary £57,500 £55,000 £50,000
% change year-on-year +4.55% +10.00% -

All Database and Business Intelligence Skills
Scotland

SQL Server is in the Databases and Business Intelligence category. The following table is for comparison with the above and provides summary statistics for all permanent job vacancies advertised in Scotland with a requirement for database or business intelligence skills.

Permanent vacancies with a requirement for database or business intelligence skills 655 1,061 1,164
As % of all permanent jobs advertised in Scotland 22.31% 21.24% 25.35%
Number of salaries quoted 429 538 648
10th Percentile £35,653 £33,750 £33,750
25th Percentile £45,000 £40,438 £40,000
Median annual salary (50th Percentile) £57,500 £52,500 £50,000
Median % change year-on-year +9.52% +5.00% -
75th Percentile £72,433 £67,500 £61,250
90th Percentile £85,000 £83,750 £74,125
UK median annual salary £60,000 £62,500 £58,500
% change year-on-year -4.00% +6.84% +6.36%

SQL Server
Job Vacancy Trend in Scotland

Job postings citing SQL Server as a proportion of all IT jobs advertised in Scotland.
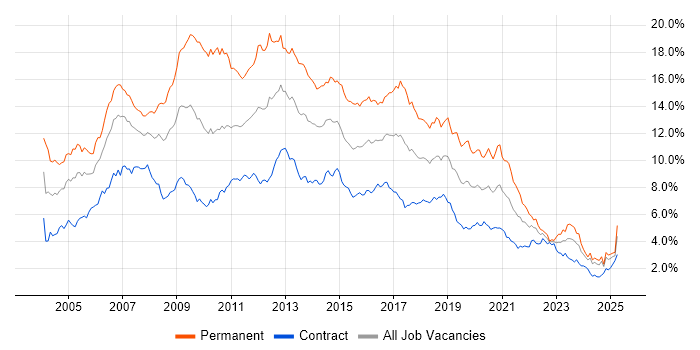
Job vacancy trend for SQL Server in Scotland

SQL Server
Salary Trend in Scotland

3-month moving average salary quoted in jobs citing SQL Server in Scotland.

Salary trend for SQL Server in Scotland

SQL Server
Salary Histogram in Scotland

Salary distribution for jobs citing SQL Server in Scotland over the 6 months to 6 December 2023.

Salary histogram for SQL Server in Scotland

SQL Server
Job Locations in Scotland

The table below looks at the demand and provides a guide to the median salaries quoted in IT jobs citing SQL Server within the Scotland region over the 6 months to 6 December 2023. The 'Rank Change' column provides an indication of the change in demand within each location based on the same 6 month period last year.

Location Rank Change
on Same Period
Last Year
Matching
Permanent
IT Job Ads
Median Salary
Past 6 Months
Median Salary
% Change
on Same Period
Last Year
Live
Jobs
Glasgow +20 87 £50,000 - 19
Edinburgh +11 40 £62,500 +25.00% 19
West Lothian +11 7 £45,000 -14.29% 1
Roxburghshire - 7 £37,500 -
Aberdeen -5 6 £52,500 +75.00% 5
Fife +9 3 £45,000 -
Stirling +5 3 £48,750 +13.37%
South Ayrshire - 3 £55,000 -
Dundee +2 2 £36,244 -39.59% 2
Ayrshire - 2 £27,500 - 1
Dunbartonshire - 2 £40,764 -
Falkirk +2 1 £50,000 -
South Lanarkshire - 1 £29,000 - 1
SQL Server
UK

SQL Server
Co-occurring Skills and Capabilities in Scotland by Category

The follow tables expand on the table above by listing co-occurrences grouped by category. The same employment type, locality and period is covered with up to 20 co-occurrences shown in each of the following categories:

Application Platforms
1 29 (15.93%) IIS
2 6 (3.30%) WebSphere
3 4 (2.20%) Confluence
3 4 (2.20%) SharePoint
3 4 (2.20%) WebLogic
4 3 (1.65%) WebSphere Application Server
5 2 (1.10%) MS Exchange
5 2 (1.10%) Tomcat
6 1 (0.55%) Apache
6 1 (0.55%) IBM Notes
6 1 (0.55%) JBoss
Applications
1 20 (10.99%) Microsoft Office
2 11 (6.04%) Microsoft Excel
Business Applications
1 14 (7.69%) Dynamics CRM
1 14 (7.69%) PlanetPress Connect
2 3 (1.65%) Oracle Receivables
3 2 (1.10%) Elite 3E
3 2 (1.10%) Primavera
4 1 (0.55%) NetSuite
4 1 (0.55%) Oracle EBS
Cloud Services
1 56 (30.77%) Azure
2 29 (15.93%) Power Platform
3 22 (12.09%) AWS
4 20 (10.99%) Microsoft 365
5 11 (6.04%) Cloud Computing
5 11 (6.04%) SaaS
6 9 (4.95%) Azure Sentinel
6 9 (4.95%) Entra ID
7 6 (3.30%) Azure DevOps
8 5 (2.75%) Azure Functions
8 5 (2.75%) Serverless
9 4 (2.20%) OneDrive
10 3 (1.65%) Azure AKS
10 3 (1.65%) Azure Cosmos DB
10 3 (1.65%) Azure Synapse Analytics
10 3 (1.65%) GitHub
10 3 (1.65%) IaaS
10 3 (1.65%) PaaS
10 3 (1.65%) Power Automate
11 2 (1.10%) Snowflake
Communications & Networking
1 20 (10.99%) WAN
2 10 (5.49%) Firewall
3 9 (4.95%) DNS
4 8 (4.40%) DHCP
5 6 (3.30%) Wireless
6 5 (2.75%) VPN
7 3 (1.65%) DMZ
7 3 (1.65%) Internet
7 3 (1.65%) Intranet
8 2 (1.10%) LAN
8 2 (1.10%) SAN
8 2 (1.10%) TCP/IP
9 1 (0.55%) DKIM
9 1 (0.55%) DMARC
9 1 (0.55%) Intrusion Detection
9 1 (0.55%) SMTP
9 1 (0.55%) SSL
Database & Business Intelligence
1 38 (20.88%) Data Warehouse
2 28 (15.38%) Power BI
3 27 (14.84%) SQL Server Integration Services
4 23 (12.64%) SQL Server Reporting Services
5 17 (9.34%) NoSQL
6 9 (4.95%) Relational Database
7 7 (3.85%) MongoDB
8 4 (2.20%) MySQL
8 4 (2.20%) Oracle Database
8 4 (2.20%) Oracle Database 10g
9 3 (1.65%) BusinessObjects
9 3 (1.65%) BusinessObjects Business Intelligence
9 3 (1.65%) PostgreSQL
10 2 (1.10%) Azure SQL Database
10 2 (1.10%) DB2
10 2 (1.10%) Redis
10 2 (1.10%) SQL Server Analysis Services
10 2 (1.10%) Tableau
11 1 (0.55%) Crystal Reports
11 1 (0.55%) DTS
Development Applications
1 22 (12.09%) JIRA
2 18 (9.89%) Git
3 16 (8.79%) SQL Server Management Studio (SSMS)
4 6 (3.30%) NUnit
5 5 (2.75%) Jasmine
5 5 (2.75%) Jenkins
6 3 (1.65%) Karma Test Runner
6 3 (1.65%) Maven
6 3 (1.65%) Oracle APEX
6 3 (1.65%) SonarQube
6 3 (1.65%) Subversion
6 3 (1.65%) Visual Studio Code
7 2 (1.10%) GitLab
7 2 (1.10%) Postman
7 2 (1.10%) Travis CI
8 1 (0.55%) Moq
8 1 (0.55%) SpecFlow
General
1 51 (28.02%) Finance
2 32 (17.58%) Social Skills
3 26 (14.29%) Inclusion and Diversity
4 22 (12.09%) Analytical Skills
5 21 (11.54%) Banking
6 16 (8.79%) Manufacturing
6 16 (8.79%) Retail
7 10 (5.49%) Marketing
8 8 (4.40%) Telecoms
9 6 (3.30%) Law
9 6 (3.30%) Public Sector
10 5 (2.75%) Automotive
11 4 (2.20%) Private Banking
12 3 (1.65%) Aerospace
12 3 (1.65%) Organisational Skills
13 1 (0.55%) Agriculture
13 1 (0.55%) Documentation Skills
13 1 (0.55%) Presentation Skills
13 1 (0.55%) Retail Banking
Job Titles
1 48 (26.37%) Analyst
2 43 (23.63%) Senior
3 32 (17.58%) Applications Support
3 32 (17.58%) Support Analyst
4 31 (17.03%) Applications Support Analyst
5 30 (16.48%) Developer
6 15 (8.24%) Systems Engineer
7 12 (6.59%) Infrastructure Engineer
7 12 (6.59%) IT Support
8 11 (6.04%) Software Engineer
9 10 (5.49%) Administrator
10 9 (4.95%) .NET Developer
10 9 (4.95%) DBA
10 9 (4.95%) Senior Infrastructure Engineer
11 8 (4.40%) Senior Developer
12 7 (3.85%) IT Support Technician
12 7 (3.85%) IT Technician
12 7 (3.85%) Senior IT Technician
12 7 (3.85%) Support Engineer
12 7 (3.85%) Support Technician
Libraries, Frameworks & Software Standards
1 33 (18.13%) .NET
2 21 (11.54%) CSS
3 14 (7.69%) ASP.NET
3 14 (7.69%) HTML
4 13 (7.14%) REST
5 12 (6.59%) AngularJS
6 11 (6.04%) React
7 7 (3.85%) Node.js
7 7 (3.85%) WebRTC
8 6 (3.30%) .NET Framework
8 6 (3.30%) ASP.NET MVC
8 6 (3.30%) jQuery
8 6 (3.30%) Middleware
9 5 (2.75%) OAuth
9 5 (2.75%) Web Services
9 5 (2.75%) XML
10 4 (2.20%) ASP.NET MVC 3
10 4 (2.20%) JSON
10 4 (2.20%) Sass
10 4 (2.20%) SOAP
Miscellaneous
1 18 (9.89%) Clustering
2 13 (7.14%) Data Structures
3 12 (6.59%) Distributed Systems
3 12 (6.59%) Public Cloud
4 10 (5.49%) Product Ownership
5 8 (4.40%) Virtual Team
6 5 (2.75%) Cloud Native
6 5 (2.75%) Data Centre
6 5 (2.75%) Management Information System
7 4 (2.20%) IoT
7 4 (2.20%) Renewable Energy
8 3 (1.65%) Augmented Reality
8 3 (1.65%) Data Protection Act
8 3 (1.65%) Enterprise Software
8 3 (1.65%) PKI
8 3 (1.65%) Virtual Reality
9 2 (1.10%) CCTV
9 2 (1.10%) Driving Licence
9 2 (1.10%) Freedom of Information
9 2 (1.10%) Life Science
Operating Systems
1 40 (21.98%) Windows
2 18 (9.89%) Windows Server
3 11 (6.04%) Linux
4 9 (4.95%) Unix
5 4 (2.20%) Windows 10
5 4 (2.20%) Windows Server 2016
6 3 (1.65%) CentOS
7 2 (1.10%) Windows Server 2012
7 2 (1.10%) Windows Server 2019
Processes & Methodologies
1 57 (31.32%) Problem-Solving
2 42 (23.08%) Agile
3 38 (20.88%) ITIL
4 35 (19.23%) Business Intelligence
5 32 (17.58%) CI/CD
6 26 (14.29%) Service Management
7 22 (12.09%) Software Testing
8 20 (10.99%) DevOps
9 19 (10.44%) ETL
9 19 (10.44%) ITSM
10 18 (9.89%) High Availability
11 17 (9.34%) Actionable Insight
12 16 (8.79%) Analytics
13 15 (8.24%) Prototyping
13 15 (8.24%) Software Engineering
14 14 (7.69%) CRM
14 14 (7.69%) Document Management
14 14 (7.69%) Release Management
15 13 (7.14%) Infrastructure Engineering
16 12 (6.59%) Project Delivery
Programming Languages
1 102 (56.04%) SQL
2 31 (17.03%) T-SQL
3 23 (12.64%) Java
4 20 (10.99%) JavaScript
5 19 (10.44%) C#
6 15 (8.24%) PowerShell
7 12 (6.59%) PL/SQL
8 8 (4.40%) Python
8 8 (4.40%) Shell Script
9 4 (2.20%) TypeScript
10 3 (1.65%) Bash
10 3 (1.65%) MATLAB
11 2 (1.10%) Go
11 2 (1.10%) Perl
11 2 (1.10%) Ruby
11 2 (1.10%) XPath
12 1 (0.55%) C++
12 1 (0.55%) Rust
12 1 (0.55%) VB.NET
12 1 (0.55%) VBScript
Qualifications
1 33 (18.13%) Security Cleared
2 30 (16.48%) Degree
3 19 (10.44%) SC Cleared
4 4 (2.20%) Computer Science Degree
5 3 (1.65%) BPSS Clearance
5 3 (1.65%) ITIL Certification
6 1 (0.55%) ITIL Foundation Certificate
6 1 (0.55%) Master's Degree
6 1 (0.55%) Microsoft Certification
Quality Assurance & Compliance
1 5 (2.75%) Data Quality
2 3 (1.65%) Accessibility
2 3 (1.65%) Disclosure Scotland
2 3 (1.65%) ISO/IEC 27001
2 3 (1.65%) QA
2 3 (1.65%) WAI
3 2 (1.10%) ISO 9001
4 1 (0.55%) Cyber Essentials
4 1 (0.55%) Cyber Essentials PLUS
4 1 (0.55%) HMG Security Policy Framework
System Software
1 22 (12.09%) Active Directory
2 15 (8.24%) VMware NSX
3 7 (3.85%) VMware Infrastructure
4 3 (1.65%) Docker
4 3 (1.65%) Hyper-V
4 3 (1.65%) Virtual Machines
5 2 (1.10%) Microsoft Virtual Server
5 2 (1.10%) Virtual Servers
6 1 (0.55%) VMware ESXi
Systems Management
1 6 (3.30%) Terraform
2 4 (2.20%) Ansible
2 4 (2.20%) Kubernetes
3 3 (1.65%) Microsoft Intune
3 3 (1.65%) Oracle RMAN
4 2 (1.10%) MIIS
4 2 (1.10%) SCCM
5 1 (0.55%) Progress Chef
5 1 (0.55%) SCVMM
5 1 (0.55%) Single Sign-On
5 1 (0.55%) vCenter Server
Vendors
1 88 (48.35%) Microsoft
2 27 (14.84%) Oracle
2 27 (14.84%) VMware
3 14 (7.69%) FNZ
4 11 (6.04%) SAP
5 10 (5.49%) Teradata
6 3 (1.65%) CheckPoint
6 3 (1.65%) Cisco
6 3 (1.65%) MicroStrategy
6 3 (1.65%) ServiceNow
7 2 (1.10%) Adobe
7 2 (1.10%) Ariba
7 2 (1.10%) Splunk
8 1 (0.55%) Commvault
8 1 (0.55%) Dell
8 1 (0.55%) HP
8 1 (0.55%) Hyperion
8 1 (0.55%) Juniper
8 1 (0.55%) Lotus
8 1 (0.55%) Sophos