Visualisation Job Trends

Visualization
UK

The table below provides summary statistics and salary benchmarking for jobs requiring Visualisation skills. It covers permanent job vacancies from the 6 months leading up to 22 November 2025, with comparisons to the same periods in the previous two years.

6 months to
22 Nov 2025
Same period 2024 Same period 2023
Rank 147 125 119
Rank change year-on-year -22 -6 -2
Permanent jobs citing Visualisation 1,015 1,410 1,418
As % of all permanent jobs in the UK 1.90% 2.06% 2.71%
As % of the Processes & Methodologies category 2.23% 2.45% 2.89%
Number of salaries quoted 491 743 1,030
10th Percentile £36,650 £40,000 £36,250
25th Percentile £41,250 £50,000 £42,500
Median annual salary (50th Percentile) £57,500 £67,500 £59,500
Median % change year-on-year -14.81% +13.45% -0.83%
75th Percentile £72,500 £85,000 £72,500
90th Percentile £90,000 £105,000 £87,850
UK excluding London median annual salary £45,250 £58,000 £50,000
% change year-on-year -21.98% +16.00% -

All Process and Methodology Skills
UK

Visualisation falls under the Processes and Methodologies category. For comparison with the information above, the following table provides summary statistics for all permanent job vacancies requiring process or methodology skills.

Permanent vacancies with a requirement for process or methodology skills 45,432 57,470 49,015
As % of all permanent jobs advertised in the UK 85.24% 83.88% 93.81%
Number of salaries quoted 27,673 30,239 37,620
10th Percentile £28,250 £33,975 £32,500
25th Percentile £36,250 £45,000 £43,750
Median annual salary (50th Percentile) £55,000 £60,000 £60,000
Median % change year-on-year -8.33% - -
75th Percentile £75,000 £78,750 £80,000
90th Percentile £95,000 £97,500 £98,750
UK excluding London median annual salary £47,500 £54,150 £52,500
% change year-on-year -12.28% +3.14% -

Visualisation
Job Vacancy Trend

Historical trend showing the proportion of permanent IT job postings citing Visualisation relative to all permanent IT jobs advertised.
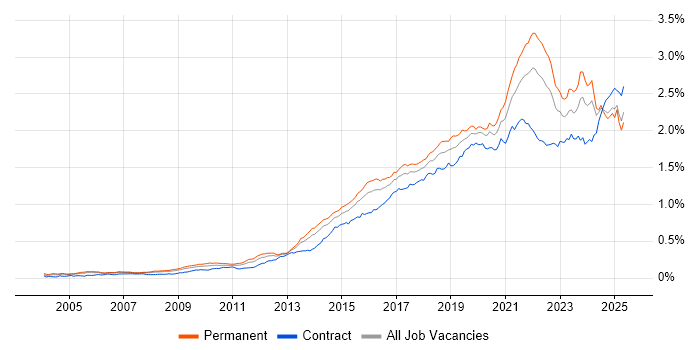
Visualisation job vacancy trend in the UK

Visualisation
Salary Trend

Salary distribution trend for jobs in the UK citing Visualisation.

Salary distribution trend for jobs in the UK citing Visualisation

Visualisation
Salary Histogram

Salary distribution for jobs citing Visualisation over the 6 months to 22 November 2025.

Salary histogram for Visualisation in the UK

Visualisation
Top 17 Job Locations

The table below looks at the demand and provides a guide to the median salaries quoted in IT jobs citing Visualisation within the UK over the 6 months to 22 November 2025. The 'Rank Change' column provides an indication of the change in demand within each location based on the same 6 month period last year.

Location Rank Change
on Same Period
Last Year
Matching
Permanent
IT Job Ads
Median Salary
Past 6 Months
Median Salary
% Change
on Same Period
Last Year
Live
Jobs
England -25 858 £57,500 -14.81% 827
UK excluding London +30 574 £45,250 -21.98% 473
London -35 370 £70,000 -9.68% 451
Work from Home -14 298 £57,500 -20.69% 406
South East +28 189 £49,000 -24.62% 161
North of England +2 106 £45,000 -15.09% 84
Midlands +57 97 £44,000 -20.00% 83
Scotland +11 84 £51,250 -35.94% 27
North West +31 63 £45,000 -17.87% 47
South West -2 54 £43,750 -20.45% 55
East Midlands +42 49 £42,500 -24.78% 30
West Midlands +31 48 £52,500 -3.39% 52
East of England +6 32 £57,500 -20.69% 48
Yorkshire -21 30 £45,000 -10.00% 28
North East +22 13 £47,500 -5.00% 12
Wales +6 9 £41,250 -13.16% 15
Northern Ireland +7 5 - - 13

Visualisation
Co-Occurring Skills & Capabilities by Category

The following tables expand on the one above by listing co-occurrences grouped by category. They cover the same employment type, locality and period, with up to 20 co-occurrences shown in each category:

Application Platforms
1 47 (4.63%) Apache Spark
2 38 (3.74%) SharePoint
3 32 (3.15%) Confluence
4 18 (1.77%) Apache Airflow
5 14 (1.38%) Apache
6 6 (0.59%) Camunda
6 6 (0.59%) Oracle Workflow
7 5 (0.49%) CMS
7 5 (0.49%) Jupyter
7 5 (0.49%) WordPress
8 4 (0.39%) Apache Synapse
8 4 (0.39%) ArcGIS
9 3 (0.30%) Microsoft Exchange
9 3 (0.30%) SAS
9 3 (0.30%) Tomcat
10 2 (0.20%) R Markdown
10 2 (0.20%) Sitecore CMS
11 1 (0.099%) Apache Superset
11 1 (0.099%) Drupal
Applications
1 195 (19.21%) Microsoft Excel
2 21 (2.07%) Microsoft Office
3 15 (1.48%) AutoCAD
4 12 (1.18%) Microsoft PowerPoint
4 12 (1.18%) MS Visio
5 8 (0.79%) SOLIDWORKS
6 6 (0.59%) Trello
7 4 (0.39%) Adobe After Effects
7 4 (0.39%) Microsoft Project
8 3 (0.30%) Adobe Illustrator
8 3 (0.30%) Adobe XD
8 3 (0.30%) Photoshop
8 3 (0.30%) Spreadsheet
9 2 (0.20%) Adobe Premiere
9 2 (0.20%) Civil 3D
9 2 (0.20%) Maya
9 2 (0.20%) Navisworks
9 2 (0.20%) ProjectWise
9 2 (0.20%) Revit
9 2 (0.20%) Sketch
Business Applications
1 53 (5.22%) SAP S/4HANA
2 15 (1.48%) NetSuite
3 6 (0.59%) Dynamics CRM
4 3 (0.30%) Aladdin
4 3 (0.30%) Bloomberg AIM
4 3 (0.30%) Dynamics GP
5 2 (0.20%) Salesforce CRM
5 2 (0.20%) SAP PM
5 2 (0.20%) Towers Watson Igloo
6 1 (0.099%) Payment Gateway
6 1 (0.099%) SAP Business One
6 1 (0.099%) SAP Oil and Gas
6 1 (0.099%) Temenos T24
Cloud Services
1 458 (45.12%) Power Platform
2 224 (22.07%) Azure
3 126 (12.41%) AWS
4 81 (7.98%) GCP
5 70 (6.90%) Azure DevOps
6 69 (6.80%) Snowflake
7 67 (6.60%) Azure Data Factory
8 56 (5.52%) Azure Synapse Analytics
9 42 (4.14%) Microsoft 365
10 41 (4.04%) Power Automate
11 34 (3.35%) Amazon S3
12 33 (3.25%) PowerApps
13 30 (2.96%) Google Analytics
14 29 (2.86%) GitHub
15 25 (2.46%) Amazon EKS
16 22 (2.17%) Fivetran
16 22 (2.17%) Serverless
17 20 (1.97%) Dynamics 365
17 20 (1.97%) Figma
18 19 (1.87%) dbt
Communications & Networking
1 7 (0.69%) Firewall
1 7 (0.69%) LAN
1 7 (0.69%) WAN
2 6 (0.59%) Wi-Fi
3 4 (0.39%) Internet
4 3 (0.30%) Modbus
5 2 (0.20%) MQTT
5 2 (0.20%) Profibus
5 2 (0.20%) PuTTY
5 2 (0.20%) VPN
6 1 (0.099%) ADSL
6 1 (0.099%) Ethernet
6 1 (0.099%) TETRA
Database & Business Intelligence
1 456 (44.93%) Power BI
2 210 (20.69%) Tableau
3 97 (9.56%) SQL Server
4 68 (6.70%) Data Warehouse
5 60 (5.91%) BigQuery
6 49 (4.83%) Azure SQL Database
7 47 (4.63%) Looker
8 42 (4.14%) Metadata
8 42 (4.14%) SQL Server Reporting Services
9 41 (4.04%) Data Lake
10 38 (3.74%) NoSQL
11 28 (2.76%) Big Data
11 28 (2.76%) Data Mining
12 25 (2.46%) Spark SQL
13 24 (2.36%) Amazon Redshift
14 23 (2.27%) Delta Lake
14 23 (2.27%) Relational Database
15 22 (2.17%) BusinessObjects
16 21 (2.07%) MySQL
17 20 (1.97%) Power Query
Development Applications
1 100 (9.85%) JIRA
2 53 (5.22%) eCATT
3 22 (2.17%) MLflow
3 22 (2.17%) NeoLoad
4 20 (1.97%) Git
5 11 (1.08%) Jenkins
6 10 (0.99%) JUnit
7 8 (0.79%) Visual Studio
8 7 (0.69%) Cypress.io
8 7 (0.69%) webpack
9 6 (0.59%) Vite
10 3 (0.30%) Spinnaker
11 2 (0.20%) Selenium
11 2 (0.20%) SQL Server Management Studio (SSMS)
12 1 (0.099%) Atlassian Bamboo
12 1 (0.099%) IntelliJ
12 1 (0.099%) Karma Test Runner
12 1 (0.099%) Maven
12 1 (0.099%) RStudio
12 1 (0.099%) WebDriver
General
1 450 (44.33%) Finance
2 399 (39.31%) Social Skills
3 358 (35.27%) Analytical Skills
4 204 (20.10%) Law
5 195 (19.21%) Marketing
6 174 (17.14%) Inclusion and Diversity
7 108 (10.64%) Banking
8 92 (9.06%) Manufacturing
9 90 (8.87%) Presentation Skills
10 72 (7.09%) Influencing Skills
11 62 (6.11%) Retail
12 49 (4.83%) Public Sector
13 40 (3.94%) Front Office
14 38 (3.74%) Legal
15 30 (2.96%) Organisational Skills
16 28 (2.76%) Advertising
17 22 (2.17%) French Language
18 19 (1.87%) Documentation Skills
19 18 (1.77%) Games
20 15 (1.48%) Telecoms
Job Titles
1 316 (31.13%) Analyst
2 213 (20.99%) Senior
3 145 (14.29%) Developer
4 134 (13.20%) Data Analyst
5 109 (10.74%) Lead
6 105 (10.34%) Software Engineer
7 62 (6.11%) Data Engineer
8 61 (6.01%) Senior Analyst
9 50 (4.93%) Java Engineer
9 50 (4.93%) Java Software Engineer
10 45 (4.43%) Data Scientist
11 41 (4.04%) Business Intelligence Developer
12 35 (3.45%) Senior Developer
13 34 (3.35%) Business Intelligence Analyst
14 32 (3.15%) Insight Analyst
15 27 (2.66%) Performance Analyst
15 27 (2.66%) Python Engineer
16 26 (2.56%) Operations Engineer
16 26 (2.56%) Python Software Engineer
17 24 (2.36%) Commercial Analyst
Libraries, Frameworks & Software Standards
1 70 (6.90%) React
2 55 (5.42%) PySpark
3 40 (3.94%) Spring
4 37 (3.65%) CSS
5 36 (3.55%) Pandas
6 35 (3.45%) scikit-learn
7 33 (3.25%) NumPy
8 32 (3.15%) Kafka
9 29 (2.86%) REST
10 28 (2.76%) PyTorch
11 25 (2.46%) TensorFlow
12 24 (2.36%) HTML
12 24 (2.36%) Spring Boot
13 21 (2.07%) FIX Protocol
13 21 (2.07%) Highcharts JS
13 21 (2.07%) WebSockets
14 20 (1.97%) Lambda Expressions
15 19 (1.87%) AngularJS
15 19 (1.87%) Keras
15 19 (1.87%) Metaflow
Miscellaneous
1 122 (12.02%) Algorithms
2 62 (6.11%) Analytical Mindset
3 39 (3.84%) Cloud Native
4 37 (3.65%) Product Ownership
5 36 (3.55%) Self-Motivation
6 31 (3.05%) Onboarding
7 27 (2.66%) Fixed Income
8 26 (2.56%) Management Information System
9 21 (2.07%) Data Structures
9 21 (2.07%) Linux Command Line
10 17 (1.67%) Blog
11 14 (1.38%) FMCG
12 13 (1.28%) Distributed Systems
12 13 (1.28%) Public Cloud
13 12 (1.18%) Social Media
14 11 (1.08%) Reinsurance
15 10 (0.99%) Data Protection Act
15 10 (0.99%) Derivative
15 10 (0.99%) IoT
15 10 (0.99%) Low-Code
Operating Systems
1 30 (2.96%) Unix
2 14 (1.38%) Linux
3 12 (1.18%) Windows
4 5 (0.49%) Android
5 4 (0.39%) Apple iOS
6 3 (0.30%) Windows Server
7 2 (0.20%) Mac OS
Processes & Methodologies
1 472 (46.50%) Business Intelligence
2 470 (46.31%) Data Visualisation
3 444 (43.74%) Analytics
4 329 (32.41%) Decision-Making
5 294 (28.97%) Agile
6 285 (28.08%) Problem-Solving
7 256 (25.22%) Continuous Improvement
8 241 (23.74%) AI
9 214 (21.08%) Data Analysis
10 204 (20.10%) Data Science
11 198 (19.51%) Machine Learning
12 196 (19.31%) Actionable Insight
13 160 (15.76%) CI/CD
14 153 (15.07%) ETL
15 150 (14.78%) Data Modelling
16 149 (14.68%) Software Engineering
17 138 (13.60%) Data Analytics
18 128 (12.61%) Data Engineering
19 118 (11.63%) DevOps
19 118 (11.63%) SDLC
Programming Languages
1 486 (47.88%) SQL
2 391 (38.52%) Python
3 93 (9.16%) JavaScript
4 90 (8.87%) Java
5 59 (5.81%) R
6 53 (5.22%) Data Analysis Expressions
7 37 (3.65%) TypeScript
8 36 (3.55%) C#
9 21 (2.07%) VBA
10 16 (1.58%) Scala
11 15 (1.48%) T-SQL
12 14 (1.38%) PowerShell
13 8 (0.79%) C++
14 6 (0.59%) Bash
14 6 (0.59%) Kotlin
15 3 (0.30%) Bicep
15 3 (0.30%) PL/SQL
15 3 (0.30%) Ruby
16 2 (0.20%) ABAP
16 2 (0.20%) PHP
Qualifications
1 290 (28.57%) Degree
2 57 (5.62%) Computer Science Degree
3 55 (5.42%) Master's Degree
4 45 (4.43%) Security Cleared
5 40 (3.94%) SC Cleared
6 36 (3.55%) Microsoft Certification
7 23 (2.27%) CISSP
8 22 (2.17%) CISA
9 20 (1.97%) CISM
10 19 (1.87%) PhD
11 18 (1.77%) Numerate Degree
12 17 (1.67%) ACCA
12 17 (1.67%) CIMA
13 15 (1.48%) Azure Certification
14 12 (1.18%) CRISC
14 12 (1.18%) Six Sigma Green Belt
15 11 (1.08%) DBS Check
16 10 (0.99%) MBA
17 8 (0.79%) BPSS Clearance
18 6 (0.59%) CCNP
Quality Assurance & Compliance
1 111 (10.94%) Data Quality
2 63 (6.21%) QA
3 38 (3.74%) Accessibility
3 38 (3.74%) GDPR
4 27 (2.66%) ISO/IEC 27001
5 15 (1.48%) Actionable Recommendations
5 15 (1.48%) NIST
6 12 (1.18%) COBIT
6 12 (1.18%) GRC
6 12 (1.18%) ITGC
7 10 (0.99%) IEC 61131
8 3 (0.30%) ISO 19650
8 3 (0.30%) PMO
9 2 (0.20%) Disclosure Scotland
10 1 (0.099%) Cyber Essentials
10 1 (0.099%) EMIR
10 1 (0.099%) HIPAA
10 1 (0.099%) IFRS
10 1 (0.099%) ISO 13485
10 1 (0.099%) SOC 2
System Software
1 51 (5.02%) Docker
2 5 (0.49%) VMware Infrastructure
3 2 (0.20%) Apache Flume
3 2 (0.20%) HDFS
4 1 (0.099%) Active Directory
4 1 (0.099%) VMware NSX
Systems Management
1 66 (6.50%) Kubernetes
2 54 (5.32%) Terraform
3 50 (4.93%) HP ALM
4 20 (1.97%) Kubeflow
5 13 (1.28%) Ansible
6 10 (0.99%) Grafana
7 7 (0.69%) Kibana
8 6 (0.59%) Prometheus
9 5 (0.49%) RSA Archer
10 4 (0.39%) CASB
10 4 (0.39%) logstash
11 3 (0.30%) Argo
11 3 (0.30%) ITRS Geneos
12 2 (0.20%) Microsoft Intune
12 2 (0.20%) Oozie
Vendors
1 197 (19.41%) Microsoft
2 103 (10.15%) Databricks
3 97 (9.56%) SAP
4 89 (8.77%) Google
5 52 (5.12%) Oracle
6 50 (4.93%) HP
7 32 (3.15%) Salesforce
8 24 (2.36%) Adobe
9 22 (2.17%) Alteryx
10 19 (1.87%) OpenAI
11 17 (1.67%) Qualtrics
11 17 (1.67%) Splunk
12 13 (1.28%) ServiceNow
13 11 (1.08%) Dynatrace
14 10 (0.99%) Adaptive Insights
14 10 (0.99%) Workday
15 8 (0.79%) Cisco
16 7 (0.69%) ESRI
16 7 (0.69%) Progress
17 6 (0.59%) Informatica