Analytics Jobs in Yorkshire

Analytics
England > Yorkshire

The following table provides summary statistics for permanent job vacancies advertised in Yorkshire with a requirement for Analytics skills. Included is a benchmarking guide to the salaries offered in vacancies that have cited Analytics over the 6 months to 6 December 2023 with a comparison to the same period in the previous 2 years.

6 months to
6 Dec 2023
Same period 2022 Same period 2021
Rank 21 21 35
Rank change year-on-year 0 +14 +27
Permanent jobs citing Analytics 306 744 474
As % of all permanent jobs advertised in Yorkshire 9.50% 10.51% 6.95%
As % of the Processes & Methodologies category 9.97% 10.89% 7.29%
Number of salaries quoted 178 218 279
10th Percentile £33,750 £38,500 £32,500
25th Percentile £42,500 £47,447 £40,000
Median annual salary (50th Percentile) £59,556 £65,000 £50,000
Median % change year-on-year -8.38% +30.00% -9.09%
75th Percentile £73,625 £81,250 £65,000
90th Percentile £91,934 £108,468 £84,702
England median annual salary £65,000 £67,293 £65,000
% change year-on-year -3.41% +3.53% +4.00%

All Process and Methodology Skills
Yorkshire

Analytics is in the Processes and Methodologies category. The following table is for comparison with the above and provides summary statistics for all permanent job vacancies advertised in Yorkshire with a requirement for process or methodology skills.

Permanent vacancies with a requirement for process or methodology skills 3,069 6,829 6,498
As % of all permanent jobs advertised in Yorkshire 95.31% 96.50% 95.28%
Number of salaries quoted 2,170 3,757 4,843
10th Percentile £29,000 £31,000 £31,250
25th Percentile £39,750 £41,250 £38,750
Median annual salary (50th Percentile) £52,500 £53,750 £50,000
Median % change year-on-year -2.33% +7.50% +5.26%
75th Percentile £67,500 £71,250 £65,000
90th Percentile £84,056 £85,000 £78,750
England median annual salary £60,000 £62,500 £60,000
% change year-on-year -4.00% +4.17% +9.09%

Analytics
Job Vacancy Trend in Yorkshire

Job postings citing Analytics as a proportion of all IT jobs advertised in Yorkshire.
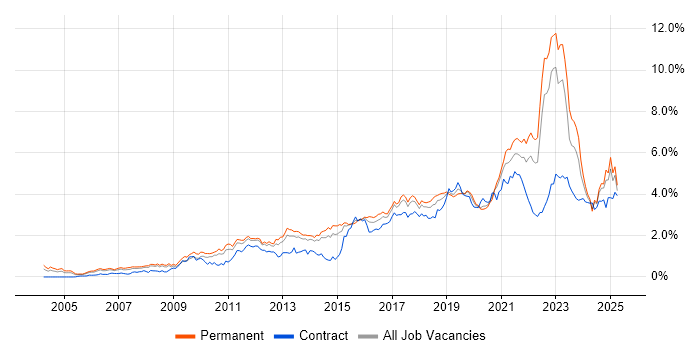
Job vacancy trend for Analytics in Yorkshire

Analytics
Salary Trend in Yorkshire

3-month moving average salary quoted in jobs citing Analytics in Yorkshire.

Salary trend for Analytics in Yorkshire

Analytics
Salary Histogram in Yorkshire

Salary distribution for jobs citing Analytics in Yorkshire over the 6 months to 6 December 2023.

Salary histogram for Analytics in Yorkshire

Analytics
Job Locations in Yorkshire

The table below looks at the demand and provides a guide to the median salaries quoted in IT jobs citing Analytics within the Yorkshire region over the 6 months to 6 December 2023. The 'Rank Change' column provides an indication of the change in demand within each location based on the same 6 month period last year.

Location Rank Change
on Same Period
Last Year
Matching
Permanent
IT Job Ads
Median Salary
Past 6 Months
Median Salary
% Change
on Same Period
Last Year
Live
Jobs
West Yorkshire -2 245 £62,500 +4.17% 69
North Yorkshire +18 27 £32,500 -58.06% 11
South Yorkshire -30 16 £50,000 -4.76% 21
East Yorkshire +6 11 £45,000 - 4
Analytics
England

Analytics
Co-occurring Skills and Capabilities in Yorkshire by Category

The follow tables expand on the table above by listing co-occurrences grouped by category. The same employment type, locality and period is covered with up to 20 co-occurrences shown in each of the following categories:

Application Platforms
1 17 (5.56%) SAS
2 13 (4.25%) Apache Spark
3 11 (3.59%) Apache
4 4 (1.31%) SharePoint
5 3 (0.98%) Confluence
6 2 (0.65%) Adobe Experience Manager
6 2 (0.65%) CMS
6 2 (0.65%) WordPress
7 1 (0.33%) Apache Airflow
7 1 (0.33%) Drupal
Applications
1 14 (4.58%) Microsoft Excel
2 4 (1.31%) Adobe XD
2 4 (1.31%) InVision
2 4 (1.31%) Microsoft PowerPoint
2 4 (1.31%) Sketch
3 2 (0.65%) SPSS
4 1 (0.33%) Microsoft Office
Business Applications
1 6 (1.96%) SAP Retail
2 3 (0.98%) Oracle ERP
3 2 (0.65%) iTrent
4 1 (0.33%) Dynamics NAV
4 1 (0.33%) Magento
Cloud Services
1 77 (25.16%) Azure
2 71 (23.20%) Power Platform
3 39 (12.75%) GCP
4 26 (8.50%) Azure DevOps
5 23 (7.52%) AWS
6 19 (6.21%) SaaS
7 18 (5.88%) Azure Data Factory
7 18 (5.88%) IaaS
8 17 (5.56%) PaaS
9 9 (2.94%) Microsoft 365
10 7 (2.29%) GitHub
10 7 (2.29%) Vertex AI
11 5 (1.63%) GitHub Actions
12 4 (1.31%) Azure Monitor
12 4 (1.31%) Figma
13 3 (0.98%) Datadog
13 3 (0.98%) Google Analytics
14 2 (0.65%) Apigee
14 2 (0.65%) Entra ID
14 2 (0.65%) PowerApps
Communications & Networking
1 2 (0.65%) Network Security
1 2 (0.65%) SMS
2 1 (0.33%) Firewall
2 1 (0.33%) Internet
Database & Business Intelligence
1 71 (23.20%) Power BI
2 27 (8.82%) Data Lake
2 27 (8.82%) Data Warehouse
3 26 (8.50%) Star Schema
4 23 (7.52%) NoSQL
5 22 (7.19%) Power Query
6 14 (4.58%) Tableau
7 11 (3.59%) Big Data
7 11 (3.59%) Data Hub
7 11 (3.59%) SQL Server Integration Services
8 10 (3.27%) Relational Database
9 9 (2.94%) SQL Server Reporting Services
10 8 (2.61%) SQL Server
11 7 (2.29%) BigQuery
12 5 (1.63%) Bigtable
12 5 (1.63%) Looker
12 5 (1.63%) MySQL
12 5 (1.63%) PostgreSQL
12 5 (1.63%) SQL Server Analysis Services
13 4 (1.31%) Microsoft Analysis Services
Development Applications
1 17 (5.56%) Jenkins
2 16 (5.23%) Git
3 10 (3.27%) SonarQube
4 9 (2.94%) Maven
4 9 (2.94%) Sonatype Nexus
5 7 (2.29%) Ant
5 7 (2.29%) Artifactory
5 7 (2.29%) Cucumber
5 7 (2.29%) Gradle
5 7 (2.29%) Mocha
5 7 (2.29%) Selenium
5 7 (2.29%) Spinnaker
5 7 (2.29%) Zephyr
6 5 (1.63%) JIRA
7 3 (0.98%) SQL Server Management Studio (SSMS)
8 2 (0.65%) GitLab
8 2 (0.65%) JUnit
8 2 (0.65%) Team Foundation Server
8 2 (0.65%) Visual Studio
9 1 (0.33%) Eclipse
General
1 128 (41.83%) Finance
2 121 (39.54%) Social Skills
3 102 (33.33%) Analytical Skills
4 100 (32.68%) Banking
5 66 (21.57%) Retail
6 47 (15.36%) Marketing
7 25 (8.17%) Presentation Skills
8 23 (7.52%) Electronics
8 23 (7.52%) Manufacturing
9 19 (6.21%) Influencing Skills
10 8 (2.61%) Law
10 8 (2.61%) Legal
10 8 (2.61%) Retail Finance
11 5 (1.63%) Advertising
11 5 (1.63%) Public Sector
12 4 (1.31%) Organisational Skills
13 3 (0.98%) Local Government
13 3 (0.98%) Retail Banking
14 2 (0.65%) Financial Institution
14 2 (0.65%) Health Technology
Job Titles
1 61 (19.93%) Analyst
2 51 (16.67%) Architect
3 38 (12.42%) Developer
4 30 (9.80%) Senior
5 28 (9.15%) Lead
6 26 (8.50%) Solutions Architect
7 25 (8.17%) Business Intelligence Developer
8 22 (7.19%) Power BI Developer
9 21 (6.86%) Presales Solution Architect
10 18 (5.88%) Senior Analyst
11 17 (5.56%) Data Scientist
12 16 (5.23%) Enterprise Architect
12 16 (5.23%) Product Owner
13 15 (4.90%) Data Engineer
14 14 (4.58%) Data Analyst
14 14 (4.58%) ITSM Analyst
15 13 (4.25%) Data Manager
16 10 (3.27%) DevOps Engineer
16 10 (3.27%) ITSM Specialist
16 10 (3.27%) Senior Data Scientist
Libraries, Frameworks & Software Standards
1 14 (4.58%) OpenID
1 14 (4.58%) PySpark
2 7 (2.29%) CSS
2 7 (2.29%) XGBoost
3 6 (1.96%) HTML
3 6 (1.96%) Kafka
3 6 (1.96%) Pandas
4 5 (1.63%) Middleware
4 5 (1.63%) Oracle Fusion
4 5 (1.63%) Spring Boot
5 3 (0.98%) .NET
5 3 (0.98%) AngularJS
5 3 (0.98%) ASP.NET
5 3 (0.98%) ASP.NET MVC
5 3 (0.98%) Sass
5 3 (0.98%) Spring
6 2 (0.65%) HTML5
6 2 (0.65%) React
6 2 (0.65%) REST
6 2 (0.65%) RESTful
Miscellaneous
1 28 (9.15%) Product Ownership
2 24 (7.84%) Credit Risk
3 18 (5.88%) Algorithms
4 16 (5.23%) Cloud Native
5 14 (4.58%) Management Information System
6 13 (4.25%) Blockchain
6 13 (4.25%) Mainframe
6 13 (4.25%) Public Cloud
7 12 (3.92%) CMDB
8 9 (2.94%) Data Structures
9 8 (2.61%) Self-Motivation
10 6 (1.96%) Robotics
11 5 (1.63%) Data Protection Act
11 5 (1.63%) Greenfield Project
12 4 (1.31%) FMCG
13 2 (0.65%) Hybrid Cloud
13 2 (0.65%) Industrial Internet of Things
13 2 (0.65%) IoT
13 2 (0.65%) Linux Command Line
14 1 (0.33%) Data Centre
Operating Systems
1 16 (5.23%) Unix
2 5 (1.63%) Linux
3 4 (1.31%) Windows
Processes & Methodologies
1 133 (43.46%) Agile
2 95 (31.05%) Problem-Solving
3 86 (28.10%) Business Intelligence
4 79 (25.82%) Data Analytics
5 65 (21.24%) Actionable Insight
6 61 (19.93%) Data Modelling
7 58 (18.95%) Visualisation
8 54 (17.65%) Decision-Making
9 50 (16.34%) Machine Learning
10 49 (16.01%) Data Science
11 45 (14.71%) DevOps
12 43 (14.05%) Technology Strategy
13 41 (13.40%) Roadmaps
14 36 (11.76%) Data Analysis
15 35 (11.44%) Thought Leadership
16 33 (10.78%) Data Strategy
17 31 (10.13%) Microservices
18 29 (9.48%) IT Strategy
18 29 (9.48%) Risk Management
19 28 (9.15%) Stakeholder Management
Programming Languages
1 110 (35.95%) SQL
2 61 (19.93%) Python
3 29 (9.48%) Data Analysis Expressions
4 13 (4.25%) R
5 11 (3.59%) JavaScript
6 7 (2.29%) Java
7 5 (1.63%) C#
8 4 (1.31%) Bash
8 4 (1.31%) PowerShell
8 4 (1.31%) T-SQL
9 3 (0.98%) PL/SQL
9 3 (0.98%) Ruby
10 2 (0.65%) C++
10 2 (0.65%) Groovy
10 2 (0.65%) TypeScript
11 1 (0.33%) Go
11 1 (0.33%) JSX
11 1 (0.33%) PHP
Qualifications
1 64 (20.92%) Degree
2 26 (8.50%) SC Cleared
2 26 (8.50%) Security Cleared
3 14 (4.58%) ITIL Certification
4 13 (4.25%) Master's Degree
5 10 (3.27%) Computer Science Degree
6 3 (0.98%) OCP
6 3 (0.98%) Oracle Certification
7 1 (0.33%) DV Cleared
Quality Assurance & Compliance
1 18 (5.88%) Data Quality
2 16 (5.23%) Actionable Recommendations
3 12 (3.92%) IFRS
3 12 (3.92%) IFRS 9
4 7 (2.29%) CRD IV
5 4 (1.31%) Accessibility
6 3 (0.98%) NIST
6 3 (0.98%) PMO
6 3 (0.98%) QA
7 2 (0.65%) SLA
8 1 (0.33%) Cyber Essentials
8 1 (0.33%) GDPR
8 1 (0.33%) ISO/IEC 27001
System Software
1 6 (1.96%) Docker
2 3 (0.98%) Active Directory
Systems Management
1 17 (5.56%) Terraform
2 10 (3.27%) Prometheus
2 10 (3.27%) Puppet
3 7 (2.29%) Kibana
3 7 (2.29%) Nagios
4 6 (1.96%) Kubernetes
5 4 (1.31%) Ansible
5 4 (1.31%) Grafana
6 3 (0.98%) Progress Chef
7 2 (0.65%) Istio
8 1 (0.33%) Salt
8 1 (0.33%) Wonderware InTouch
Vendors
1 26 (8.50%) Microsoft
2 20 (6.54%) ServiceNow
3 19 (6.21%) Google
4 18 (5.88%) Databricks
5 9 (2.94%) New Relic
6 8 (2.61%) Splunk
7 7 (2.29%) Adobe
7 7 (2.29%) Dynatrace
7 7 (2.29%) Oracle
7 7 (2.29%) SAP
7 7 (2.29%) Veracode
8 5 (1.63%) Alteryx
8 5 (1.63%) Teradata
9 3 (0.98%) AVEVA
9 3 (0.98%) GoldenSource
9 3 (0.98%) SaltStack
10 2 (0.65%) Ahrefs
10 2 (0.65%) DeepCrawl
10 2 (0.65%) Screaming Frog
11 1 (0.33%) Datix