CI/CD Jobs in England

CI/CD
UK > England

The table below provides summary statistics for permanent job vacancies advertised in England requiring CI/CD skills. It includes a benchmarking guide to the annual salaries offered in vacancies that cited CI/CD over the 6 months leading up to 31 May 2025, comparing them to the same period in the previous two years.

6 months to
31 May 2025
Same period 2024 Same period 2023
Rank 32 52 25
Rank change year-on-year +20 -27 -8
Permanent jobs citing CI/CD 3,279 3,687 7,059
As % of all permanent jobs advertised in England 6.65% 4.10% 8.29%
As % of the Processes & Methodologies category 7.08% 4.89% 8.68%
Number of salaries quoted 1,757 2,865 4,647
10th Percentile £50,000 £46,250 £48,750
25th Percentile £58,500 £55,000 £58,750
Median annual salary (50th Percentile) £72,500 £70,000 £75,000
Median % change year-on-year +3.57% -6.67% -
75th Percentile £93,750 £87,500 £95,000
90th Percentile £115,000 £105,000 £110,000
UK median annual salary £72,500 £70,000 £75,000
% change year-on-year +3.57% -6.67% +3.45%

All Process and Methodology Skills
England

CI/CD falls under the Processes and Methodologies category. For comparison with the information above, the following table provides summary statistics for all permanent job vacancies requiring process or methodology skills in England.

Permanent vacancies with a requirement for process or methodology skills 46,342 75,409 81,364
As % of all permanent jobs advertised in England 93.97% 83.96% 95.53%
Number of salaries quoted 23,102 54,812 48,959
10th Percentile £29,250 £29,000 £34,452
25th Percentile £41,250 £40,000 £46,000
Median annual salary (50th Percentile) £57,500 £55,000 £62,500
Median % change year-on-year +4.55% -12.00% +4.17%
75th Percentile £75,000 £72,500 £82,500
90th Percentile £97,528 £93,750 £102,500
UK median annual salary £57,000 £55,000 £60,899
% change year-on-year +3.64% -9.69% +1.50%

CI/CD
Job Vacancy Trend in England

Job postings citing CI/CD as a proportion of all IT jobs advertised in England.
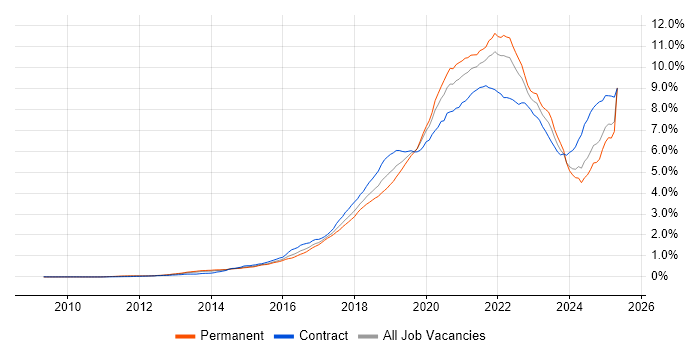
Job vacancy trend for CI/CD in England

CI/CD
Salary Trend in England

3-month moving average salary quoted in jobs citing CI/CD in England.

Salary trend for CI/CD in England

CI/CD
Salary Histogram in England

Salary distribution for jobs citing CI/CD in England over the 6 months to 31 May 2025.

Salary histogram for CI/CD in England

CI/CD
Job Locations in England

The table below looks at the demand and provides a guide to the median salaries quoted in IT jobs citing CI/CD within the England region over the 6 months to 31 May 2025. The 'Rank Change' column provides an indication of the change in demand within each location based on the same 6 month period last year.

Location Rank Change
on Same Period
Last Year
Matching
Permanent
IT Job Ads
Median Salary
Past 6 Months
Median Salary
% Change
on Same Period
Last Year
Live
Jobs
London +16 1,455 £85,000 - 1,597
North of England -9 543 £69,384 +11.01% 601
South East +6 422 £65,000 +1.56% 365
North West -22 350 £70,000 +12.00% 379
Midlands 0 232 £60,000 -4.00% 231
South West +7 203 £65,000 - 216
East of England +83 184 £65,000 +6.12% 129
Yorkshire +15 159 £70,000 +16.67% 169
West Midlands +9 152 £60,000 -7.69% 152
East Midlands +18 80 £60,000 - 78
North East +7 34 £62,752 -1.95% 56
CI/CD
UK

CI/CD
Co-occurring Skills and Capabilities in England by Category

The follow tables expand on the table above by listing co-occurrences grouped by category. The same employment type, locality and period is covered with up to 20 co-occurrences shown in each of the following categories:

Application Platforms
1 203 (6.19%) Confluence
2 124 (3.78%) Apache Spark
3 101 (3.08%) Apache Airflow
4 93 (2.84%) Apache
5 29 (0.88%) SharePoint
6 28 (0.85%) nginx
7 25 (0.76%) CMS
8 17 (0.52%) IIS
9 10 (0.30%) Apache Solr
9 10 (0.30%) OpenStack
10 8 (0.24%) Headless CMS
10 8 (0.24%) Tomcat
11 6 (0.18%) Microsoft Exchange
12 5 (0.15%) Appian
12 5 (0.15%) Drupal
12 5 (0.15%) SAS
13 4 (0.12%) Cloud Foundry
13 4 (0.12%) GemFire
13 4 (0.12%) IBM Domino
13 4 (0.12%) Umbraco
Applications
1 11 (0.34%) Maya
2 6 (0.18%) Microsoft Excel
3 4 (0.12%) Adobe XD
3 4 (0.12%) Chatbot
3 4 (0.12%) Microsoft Office
3 4 (0.12%) MS Visio
3 4 (0.12%) Sketch
4 3 (0.091%) Mozilla Thunderbird
5 2 (0.061%) Simulink
6 1 (0.030%) Adobe Illustrator
6 1 (0.030%) Elementor
6 1 (0.030%) Microsoft PowerPoint
6 1 (0.030%) Microsoft Project
6 1 (0.030%) Photoshop
6 1 (0.030%) S-PLUS
6 1 (0.030%) Trello
Business Applications
1 43 (1.31%) Dynamics CRM
2 12 (0.37%) Oracle EBS
3 7 (0.21%) Payment Gateway
4 4 (0.12%) Remedy ITSM
5 3 (0.091%) Oracle BPM
5 3 (0.091%) Salesforce CRM
5 3 (0.091%) SAP CX
6 2 (0.061%) Endur
6 2 (0.061%) SAP S/4HANA
7 1 (0.030%) Aladdin
7 1 (0.030%) Cloudability
7 1 (0.030%) Magento
7 1 (0.030%) SAP Hybris
7 1 (0.030%) SAP IBP
7 1 (0.030%) SAP MM
7 1 (0.030%) Shopify
7 1 (0.030%) Siebel CRM
Cloud Services
1 1,686 (51.42%) Azure
2 1,683 (51.33%) AWS
3 772 (23.54%) GCP
4 624 (19.03%) Serverless
5 493 (15.04%) AWS Lambda
6 410 (12.50%) Azure DevOps
7 305 (9.30%) GitHub
8 209 (6.37%) Amazon S3
9 180 (5.49%) SaaS
10 156 (4.76%) Power Platform
11 155 (4.73%) AWS CloudFormation
11 155 (4.73%) GitHub Actions
12 144 (4.39%) Amazon EKS
13 143 (4.36%) Amazon ECS
14 121 (3.69%) PaaS
15 111 (3.39%) dbt
16 99 (3.02%) AWS Step Functions
16 99 (3.02%) Azure Data Factory
17 98 (2.99%) Amazon EC2
18 94 (2.87%) Azure Monitor
Communications & Networking
1 506 (15.43%) Broadband
2 80 (2.44%) Firewall
3 55 (1.68%) DNS
4 54 (1.65%) VPN
5 39 (1.19%) Network Security
6 35 (1.07%) TCP/IP
7 34 (1.04%) HTTP
8 27 (0.82%) WAN
9 19 (0.58%) SD-WAN
10 11 (0.34%) Internet
11 10 (0.30%) Intrusion Detection
11 10 (0.30%) SAN
12 8 (0.24%) HTTPS
12 8 (0.24%) MQTT
13 7 (0.21%) IPsec
14 5 (0.15%) BGP
14 5 (0.15%) FTP
14 5 (0.15%) SMS
14 5 (0.15%) SSH
14 5 (0.15%) SSL
Database & Business Intelligence
1 382 (11.65%) SQL Server
2 238 (7.26%) NoSQL
3 196 (5.98%) PostgreSQL
4 172 (5.25%) Elasticsearch
5 158 (4.82%) MySQL
6 144 (4.39%) Relational Database
7 125 (3.81%) DynamoDB
8 124 (3.78%) MongoDB
9 108 (3.29%) Power BI
10 94 (2.87%) Data Lake
10 94 (2.87%) Data Warehouse
11 81 (2.47%) Amazon Athena
12 76 (2.32%) Big Data
13 71 (2.17%) Amazon RDS
14 63 (1.92%) Apache Iceberg
14 63 (1.92%) Apache Ignite
15 59 (1.80%) Apache Arrow
15 59 (1.80%) Dremio
16 51 (1.56%) BigQuery
17 48 (1.46%) Azure SQL Database
Development Applications
1 601 (18.33%) JIRA
2 497 (15.16%) Git
3 407 (12.41%) GitLab
4 337 (10.28%) Jenkins
5 292 (8.91%) Selenium
6 265 (8.08%) Bitbucket
7 257 (7.84%) SonarQube
8 246 (7.50%) Cucumber
9 243 (7.41%) Sonatype Nexus
10 242 (7.38%) Maven
11 83 (2.53%) JUnit
12 72 (2.20%) Artifactory
13 53 (1.62%) Cypress.io
14 52 (1.59%) TeamCity
15 48 (1.46%) JMeter
16 45 (1.37%) Postman
17 40 (1.22%) Octopus Deploy
18 38 (1.16%) CircleCI
19 36 (1.10%) NUnit
20 35 (1.07%) Mockito
General
1 1,032 (31.47%) Finance
2 706 (21.53%) Social Skills
3 487 (14.85%) Banking
4 469 (14.30%) Analytical Skills
5 451 (13.75%) Inclusion and Diversity
6 263 (8.02%) Law
7 169 (5.15%) Retail
8 135 (4.12%) Marketing
9 125 (3.81%) Investment Banking
10 123 (3.75%) Public Sector
11 114 (3.48%) Front Office
12 90 (2.74%) Corporate Banking
13 51 (1.56%) Games
14 47 (1.43%) Telecoms
15 40 (1.22%) Financial Institution
15 40 (1.22%) Manufacturing
16 30 (0.91%) Presentation Skills
17 29 (0.88%) Advertising
17 29 (0.88%) Legal
18 25 (0.76%) Automotive
Job Titles
1 939 (28.64%) Senior
2 698 (21.29%) Developer
3 581 (17.72%) Software Engineer
4 378 (11.53%) Lead
5 298 (9.09%) DevOps Engineer
6 249 (7.59%) Senior Developer
7 221 (6.74%) Release Engineer
8 220 (6.71%) Embedded Engineer
9 217 (6.62%) Machine Learning Engineer
10 202 (6.16%) Data Engineer
11 177 (5.40%) Architect
12 156 (4.76%) Cloud Engineer
13 148 (4.51%) AWS Engineer
14 147 (4.48%) Senior Software Engineer
15 139 (4.24%) Azure Engineer
16 134 (4.09%) Python Engineer
17 129 (3.93%) AWS DevOps
18 112 (3.42%) Platform Engineer
19 103 (3.14%) AWS DevOps Engineer
20 102 (3.11%) AWS Developer
Libraries, Frameworks & Software Standards
1 676 (20.62%) React
2 470 (14.33%) Kafka
3 463 (14.12%) .NET
4 379 (11.56%) Spring
5 365 (11.13%) RESTful
5 365 (11.13%) Spring Boot
6 344 (10.49%) HTML
7 341 (10.40%) CSS
8 339 (10.34%) REST
9 297 (9.06%) Middleware
10 257 (7.84%) Node.js
11 219 (6.68%) Redux
12 204 (6.22%) JPA
13 165 (5.03%) Jest
14 163 (4.97%) AngularJS
15 155 (4.73%) Hibernate
16 152 (4.64%) GraphQL
17 141 (4.30%) HTML5
18 126 (3.84%) CSS3
19 116 (3.54%) .NET Core
Miscellaneous
1 343 (10.46%) Product Ownership
2 325 (9.91%) Cloud Native
3 251 (7.65%) Enterprise Software
4 231 (7.04%) Self-Motivation
5 216 (6.59%) Embedded Systems
6 140 (4.27%) Distributed Systems
7 121 (3.69%) Management Information System
8 108 (3.29%) Public Cloud
9 93 (2.84%) Mobile App
10 69 (2.10%) Algorithms
11 50 (1.52%) Greenfield Project
12 49 (1.49%) Cyberattack
13 43 (1.31%) Legacy Systems
14 40 (1.22%) Data Structures
15 39 (1.19%) Security Posture
15 39 (1.19%) Virtual Team
16 37 (1.13%) Hybrid Cloud
17 36 (1.10%) Private Cloud
18 34 (1.04%) Data Centre
19 28 (0.85%) Onboarding
Operating Systems
1 355 (10.83%) Linux
2 150 (4.57%) Windows
3 95 (2.90%) Android
4 56 (1.71%) Unix
5 46 (1.40%) Windows Server
6 44 (1.34%) Apple iOS
7 24 (0.73%) Red Hat Enterprise Linux
8 17 (0.52%) CentOS
9 14 (0.43%) Ubuntu
10 12 (0.37%) VMS
11 7 (0.21%) Debian
12 6 (0.18%) Solaris
12 6 (0.18%) Windows Server 2016
12 6 (0.18%) zOS
13 5 (0.15%) Windows Server 2008
13 5 (0.15%) Windows Server 2019
14 4 (0.12%) Amazon Linux
14 4 (0.12%) Windows Server 2012
15 3 (0.091%) Rocky
16 2 (0.061%) Mac OS
Processes & Methodologies
1 1,981 (60.41%) Agile
2 1,669 (50.90%) DevOps
3 1,019 (31.08%) Software Engineering
4 796 (24.28%) Mentoring
5 764 (23.30%) Containerisation
6 758 (23.12%) Problem-Solving
7 736 (22.45%) Microservices
8 635 (19.37%) Test Automation
9 589 (17.96%) Infrastructure as Code
10 526 (16.04%) Clean Code
11 515 (15.71%) Artificial Intelligence
12 511 (15.58%) SDLC
13 442 (13.48%) Full-Stack Development
14 436 (13.30%) Machine Learning
15 432 (13.17%) Roadmaps
16 382 (11.65%) Continuous Improvement
17 350 (10.67%) Continuous Integration
18 349 (10.64%) Continuous Deployment
19 337 (10.28%) TDD
20 334 (10.19%) Strategic Thinking
Programming Languages
1 1,293 (39.43%) Python
2 875 (26.68%) Java
3 795 (24.25%) SQL
4 778 (23.73%) JavaScript
5 694 (21.16%) TypeScript
6 457 (13.94%) C#
7 248 (7.56%) Go
8 246 (7.50%) PowerShell
9 165 (5.03%) Bash
10 104 (3.17%) C++
11 99 (3.02%) Rust
12 80 (2.44%) Bicep
13 63 (1.92%) PHP
14 48 (1.46%) Scala
15 39 (1.19%) Ruby
16 37 (1.13%) Kotlin
17 35 (1.07%) Shell Script
18 31 (0.95%) Apex Code
18 31 (0.95%) T-SQL
19 26 (0.79%) Swift
Qualifications
1 587 (17.90%) Degree
2 260 (7.93%) Security Cleared
3 234 (7.14%) PhD
4 189 (5.76%) AWS Certification
5 174 (5.31%) Computer Science Degree
6 156 (4.76%) SC Cleared
7 137 (4.18%) Azure Certification
8 94 (2.87%) Master's Degree
9 86 (2.62%) DV Cleared
10 54 (1.65%) AWS Certified Solutions Architect
11 40 (1.22%) BPSS Clearance
12 36 (1.10%) ISTQB
13 34 (1.04%) Microsoft Certification
14 18 (0.55%) DBS Check
15 17 (0.52%) Cisco Certification
15 17 (0.52%) CISSP
15 17 (0.52%) ISTQB Foundation Certification
16 16 (0.49%) TOGAF Certification
17 15 (0.46%) (ISC)2 CCSP
18 11 (0.34%) CCSP
Quality Assurance & Compliance
1 391 (11.92%) QA
2 149 (4.54%) Accessibility
3 125 (3.81%) GDPR
4 85 (2.59%) Data Quality
5 81 (2.47%) ISO/IEC 27001
6 55 (1.68%) NIST
7 51 (1.56%) HIPAA
8 30 (0.91%) Sarbanes-Oxley
9 28 (0.85%) NCSC
10 26 (0.79%) PCI DSS
11 25 (0.76%) SOC 2
12 14 (0.43%) California Consumer Privacy Act
13 12 (0.37%) COBIT
14 7 (0.21%) SLA
15 6 (0.18%) Cyber Essentials
16 5 (0.15%) WCAG
17 4 (0.12%) Basel II
17 4 (0.12%) Basel III
17 4 (0.12%) IFRS
17 4 (0.12%) IFRS 9
System Software
1 1,003 (30.59%) Docker
2 47 (1.43%) Virtual Machines
3 46 (1.40%) VMware Infrastructure
4 40 (1.22%) Active Directory
5 12 (0.37%) Hyper-V
5 12 (0.37%) vSphere
6 10 (0.30%) Virtual Desktop
7 8 (0.24%) VMware ESXi
8 6 (0.18%) Dovecot
8 6 (0.18%) Postfix
9 5 (0.15%) Apache Flume
9 5 (0.15%) KVM
9 5 (0.15%) Squid
10 4 (0.12%) Xen
11 3 (0.091%) DFS Replication
12 2 (0.061%) HDFS
12 2 (0.061%) NFS
12 2 (0.061%) SRDF
12 2 (0.061%) Veritas Cluster Server
12 2 (0.061%) zsh
Systems Management
1 1,114 (33.97%) Kubernetes
2 778 (23.73%) Terraform
3 367 (11.19%) Ansible
4 146 (4.45%) Grafana
5 134 (4.09%) Prometheus
6 59 (1.80%) Progress Chef
7 49 (1.49%) Puppet
8 31 (0.95%) Kibana
9 26 (0.79%) Argo
9 26 (0.79%) Microsoft Intune
10 18 (0.55%) Istio
10 18 (0.55%) Single Sign-On
11 16 (0.49%) SCCM
12 15 (0.46%) Podman
13 10 (0.30%) AWS Copilot
13 10 (0.30%) Nagios
14 9 (0.27%) Red Hat Satellite
15 7 (0.21%) Packer
16 6 (0.18%) HAProxy
16 6 (0.18%) Mesos
Vendors
1 410 (12.50%) Microsoft
2 205 (6.25%) Solace
3 185 (5.64%) Databricks
3 185 (5.64%) Google
4 120 (3.66%) Oracle
5 81 (2.47%) Salesforce
6 78 (2.38%) VMware
7 55 (1.68%) Splunk
8 53 (1.62%) Atlassian
9 52 (1.59%) ServiceNow
10 40 (1.22%) Red Hat
11 35 (1.07%) MuleSoft
11 35 (1.07%) SAP
12 34 (1.04%) IBM
13 25 (0.76%) Dynatrace
14 23 (0.70%) Salesforce Marketing Cloud
15 22 (0.67%) Informatica
16 20 (0.61%) New Relic
17 19 (0.58%) Adobe
18 17 (0.52%) Cisco